Chapter 1
Changing the utilities management mindset
The “performance frontier” reflects reimagining “what good looks like” given the right mix of attributes, standards, targets and incentives.
To deliver significant results that fundamentally change the business, executive attention should be directed at creative cost take-out models that dramatically reshape the way a utility is designed to operate and the cost levels and service delivery it aspires to achieve.
These models are not conventional, targeted, simple or quick – but are powerful, enduring and consequential. For example, thinking about costs the way a financial owner (private equity) would, challenges the purpose and role of the utility and brings emphasis to costs that are “avoidable” and those that have become de-linked from operations requirements and customer value.
Previously merged utilities frequently recall the inability to fully capture the value of scale through previous transactions. Thinking about how to position to deliver on scale – something else financial investors do – elevates the nature and level of change and cost take-out.
And while customers appreciate and value lower prices, impacts to customers are diluted if service levels are not improved in tandem to drive better customer experience and value. To accomplish these goals, utilities can advantage cost take-out results by adopting an outside-in view focused on fit-for-purpose processes over activity performance and execution productivity over cost inputs.
Certain models utilized elsewhere in the world, e.g., the United Kingdom (UK), illustrate “how” to dramatically elevate future business performance, outcomes and value. This model pushes utilities beyond their comfort zone by framing the “art of the possible”, i.e., outcomes never thought possible. In these cases, emphasis moves beyond typical top-quartile positioning to leverage a North Star to continually stretch executives – the “performance frontier”. (Figure – 3)
Figure 3: Achieving the art of the possible
The performance frontier
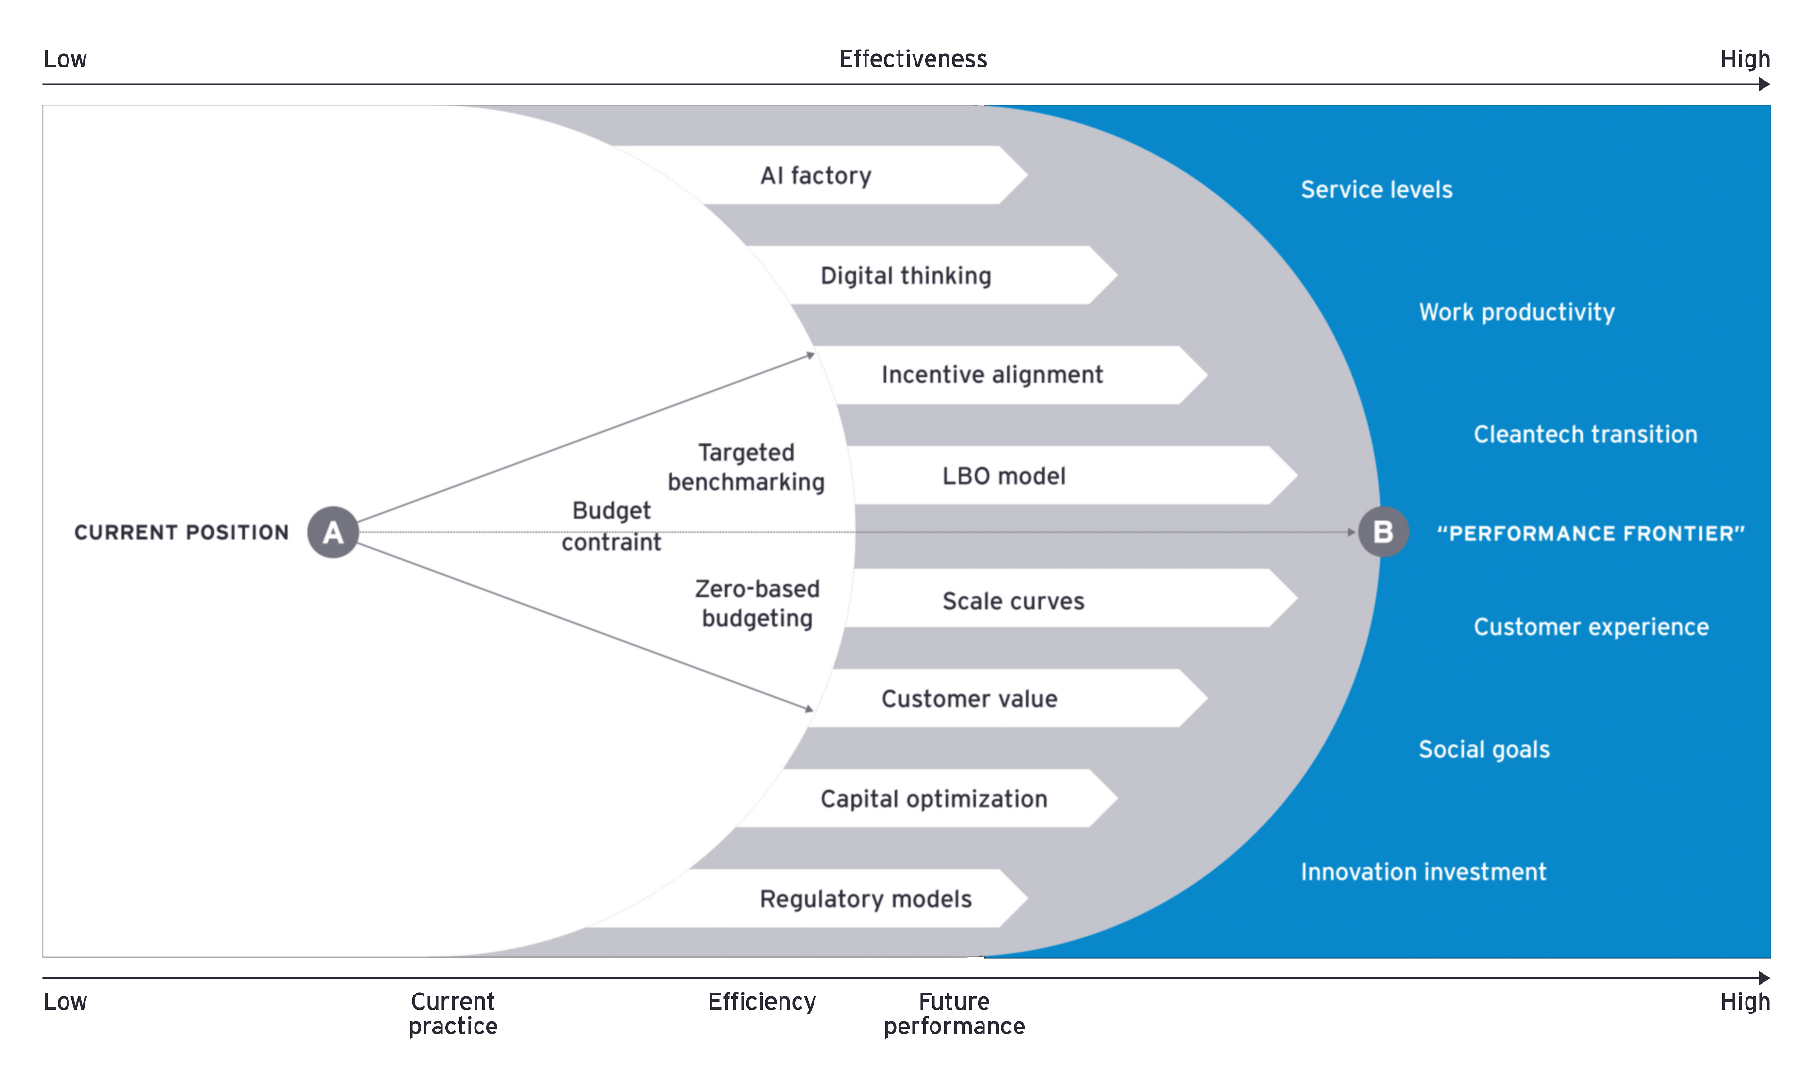
The performance frontier reflects reimagining “what good looks like” given the right mix of attributes, standards, targets and incentives. It creates a measurable framework incorporating a wide range of attributes reflecting key areas of execution across the business – a blend of internal and external outcomes that relate to inherent expectations of a utility.
While specific improvement areas can differ jurisdictionally and by utility, critical attributes typically include:
- System performance
- Customer response
- Capital efficiency
- Energy transition
- Innovative thinking
- Mandate conformance
These attributes can incorporate other areas regulators look to for better execution, lower input costs, smarter investment and/or price restraint.
Defining the attributes comprising a performance frontier is incomplete without specifying specific, tangible standards for execution. A utility needs to establish a current performance baseline, then define continually higher levels of sustained performance using comparators – domestically or internationally – and self-challenge. These data points inform an initial gap, improvement targets and paths to succeeding target levels.
Standards and targets define the goals and outcomes to be delivered or produced, reflecting cascading improvement over time. At the outset, the performance frontier end-state is not truly known – a directional heading may be visible, but the frontier is recalibrated as attainment stages are realized. Since pursuing the performance frontier is a multiyear journey toward optimal execution, near-term standards and targets represent increasingly challenging stages of future operating levels.
When a performance frontier model is adopted by utilities, internal collaboration on standards and targets occurs during the planning and budgeting process, with intense multiyear focus, “hard-wired” to financial plans and directly linked to outcomes and internal incentives.
Standards or targets need to be clear, as does integration into annual and multiyear planning. These elements do not exist outside traditional plans and budgets; they form the basis for these processes and help determine how execution priorities, technology spend, work resources and capital deployment are developed.
Adopting a performance frontier model is not a paint-by-the-numbers undertaking with selection of one approach over another. It is a complete mindset shift with reframing of business expectations, incorporating multiple complementary techniques and model to support achieving desired outcomes.

Chapter 2
Case study: the UK experience
An unconventional regulatory model represents an important lesson for the utilities sector when considering a performance frontier model.
At its heart, RPI – X was structured to recognize necessary costs and escalation and create a model to encourage RECs to constrain cost growth below annual inflation. The RPI – X model incorporated price controls and incentives as a means to achieve operating performance improvement. Customer price levels were set to recover operating expenses, capital consumption, financing costs and taxes. Operating attributes, e.g., service quality, line losses and connection, provided standards or targets to illustrate expectations for performance improvement and linked to the application or earn-out of incentives.
While utilities often view unconventional models with skepticism, they are not unproven and without meaningful impacts. RPI – X’s performance standards were established for forward-looking five-year periods to allow the RECs to reshape themselves post-privatization and achieve proscribed targets and related incentives. The RECs produced continuing O&M savings for almost 20 years, with distribution charges halved between 1990 and 2008 and operating costs reduced by 7.7% per annum between 1992 to 2003, with 3% - 9% annual efficiency gains in succeeding years.5, 6 (Figure – 4)
Figure 4: Selected RPI-X experience
UK electricity: Operating expenditures and customer interruptions, 1991-2021
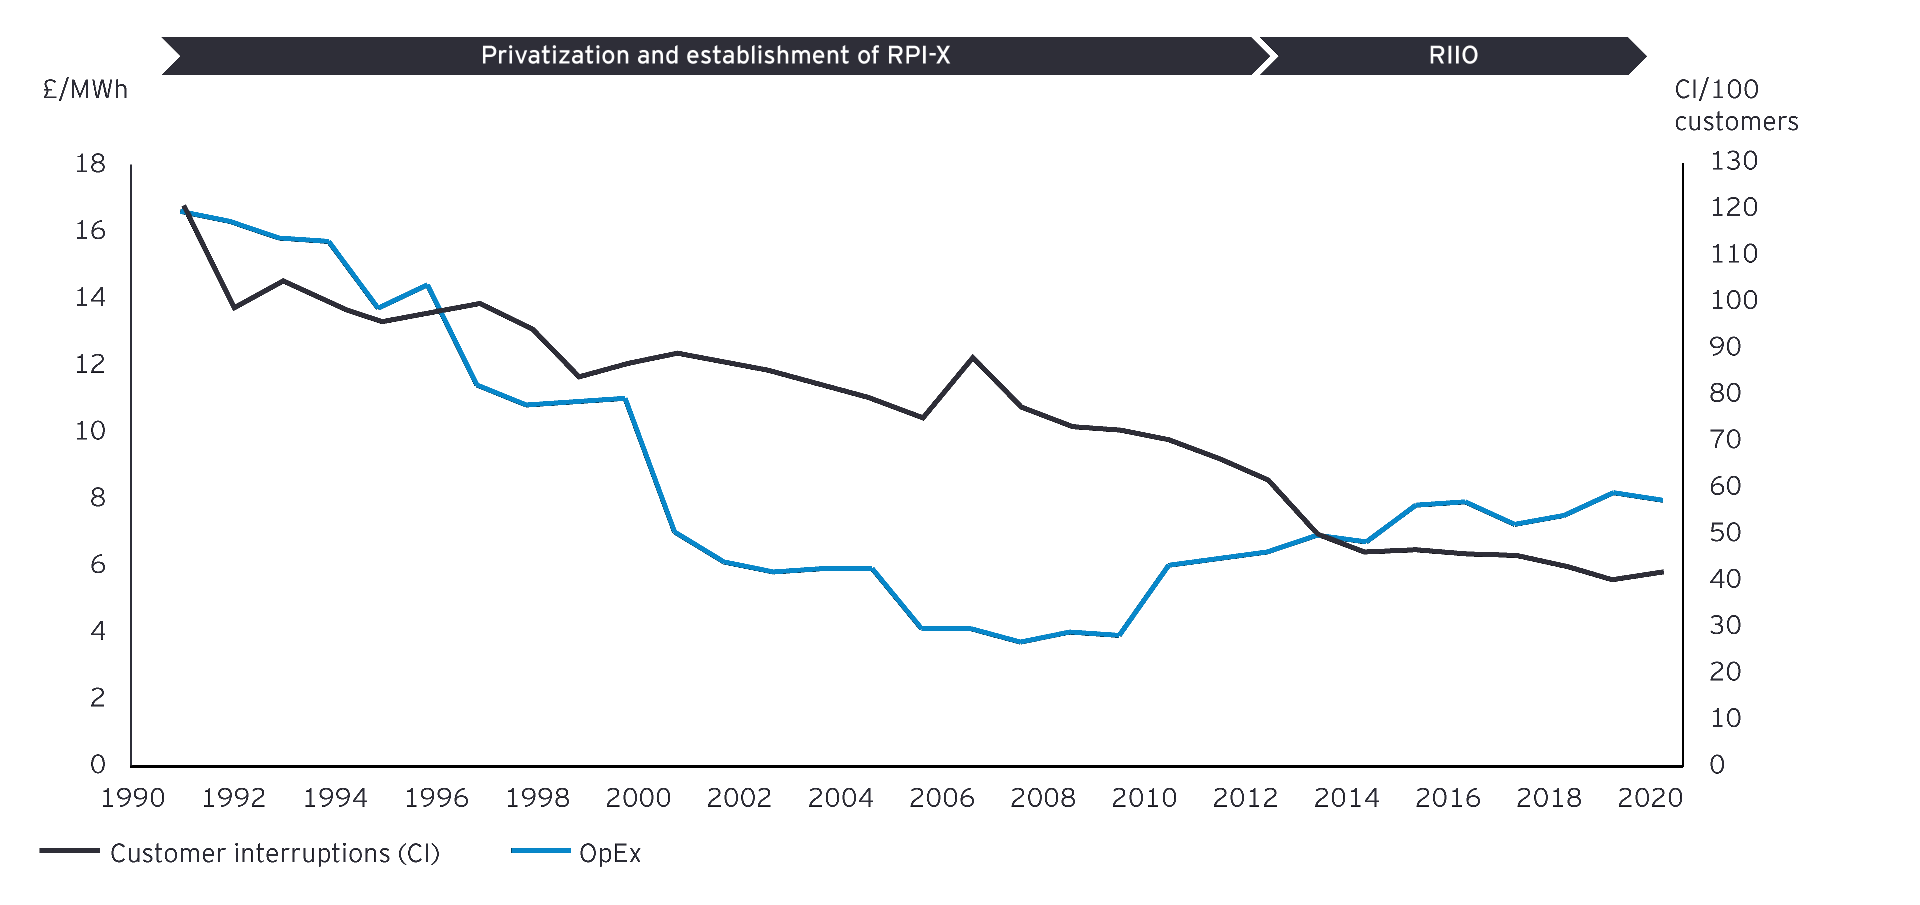
Consistent improvement in service quality and reliability also occurred with a 30% decline in average customer interruptions and improved operating reliability, with 5.5% and 3.1% changes, respectively, achieved per annum between 1990 to 2006. 7 The RECs also increased capital investment by 37% between the baseline of 1986 to 1990 and 1990 to 2004.8
Customers benefitted from lower costs and improved service, with RECs able to substitute capital for O&M and modernize networks to substantially reduce system failures. Importantly, the RECs learned how to work within parameters of RPI – X to grow the business and earn above authorized return levels. This lesson is an important feature and outcome to utilities that consider a similar performance frontier model – it enables companies to create enhanced returns by performing at better-than-traditional levels.
After incentivizing innovation and elevating the narrative on sustainability through RPI – X, an Office of Gas and Electric Markets (Ofgem) replaced Offer and created a new model: Revenues = Innovation + Investment + Outputs (RIIO), which addressed Distribution Network Operator (DNO) spend and enhanced information quality required from the DNOs. Total expenditure (TotEx = capital and operating expenditures) considerations were prioritized to recognize spend trade-offs (capital over O&M) previously made and improve estimate accuracy. An Information Quality Incentive (IQI) was adopted to reward/penalize DNOs related to target accuracy compared to OFGEM estimates.9
RIIO initially adopted an eight-year (2015 to 2023) measurement period, and Ofgem has begun its initial performance review. Early observations include a general under-spending in innovation, TotEx expected to be 5% less than targets, and DNOs earning incentives up to 300 basis points above allowed returns. In the first two years of RIIO, DNOs improved network reliability by 11% with network innovation increases encompassing >100 projects approved.10
As RIIO-1 advances to RIIO-2, new adjustments have been outlined, including reducing the evaluation period from eight to five years, linking funding to output delivery, adding incentives for delivery out-performance, creating funding flexibility through uncertainty mechanisms, increasing efficiency targets, lowering incentive rates, indexing input prices and metrics, reducing the cost of equity allowance, adding an “outperformance wedge” of 25 basis points and normalizing mechanisms if companies significantly underperform or outperform ROEs.11

Chapter 3
The path to the performance frontier
Executives need clarity on purpose, progress, continuity, evolution, reporting and linkage to other internal and external mechanisms.
This model reflects the concept of reimagining priorities, spend, execution, outcomes and value to define a price cap and requires executives to fundamentally recalibrate views of “what good looks like” to drive a complete reset of expected performance. Incremental thinking gives way to more radical perspectives challenging foundational aspects of the business.
The performance frontier model dictates that if customer and shareholder value cannot be demonstrated, related capital or O&M should not be spent where observed value is elusive. This model starts with painting a clear and compelling view of “what” is being asked, and “how” it will be attained from adoption through continuous application.
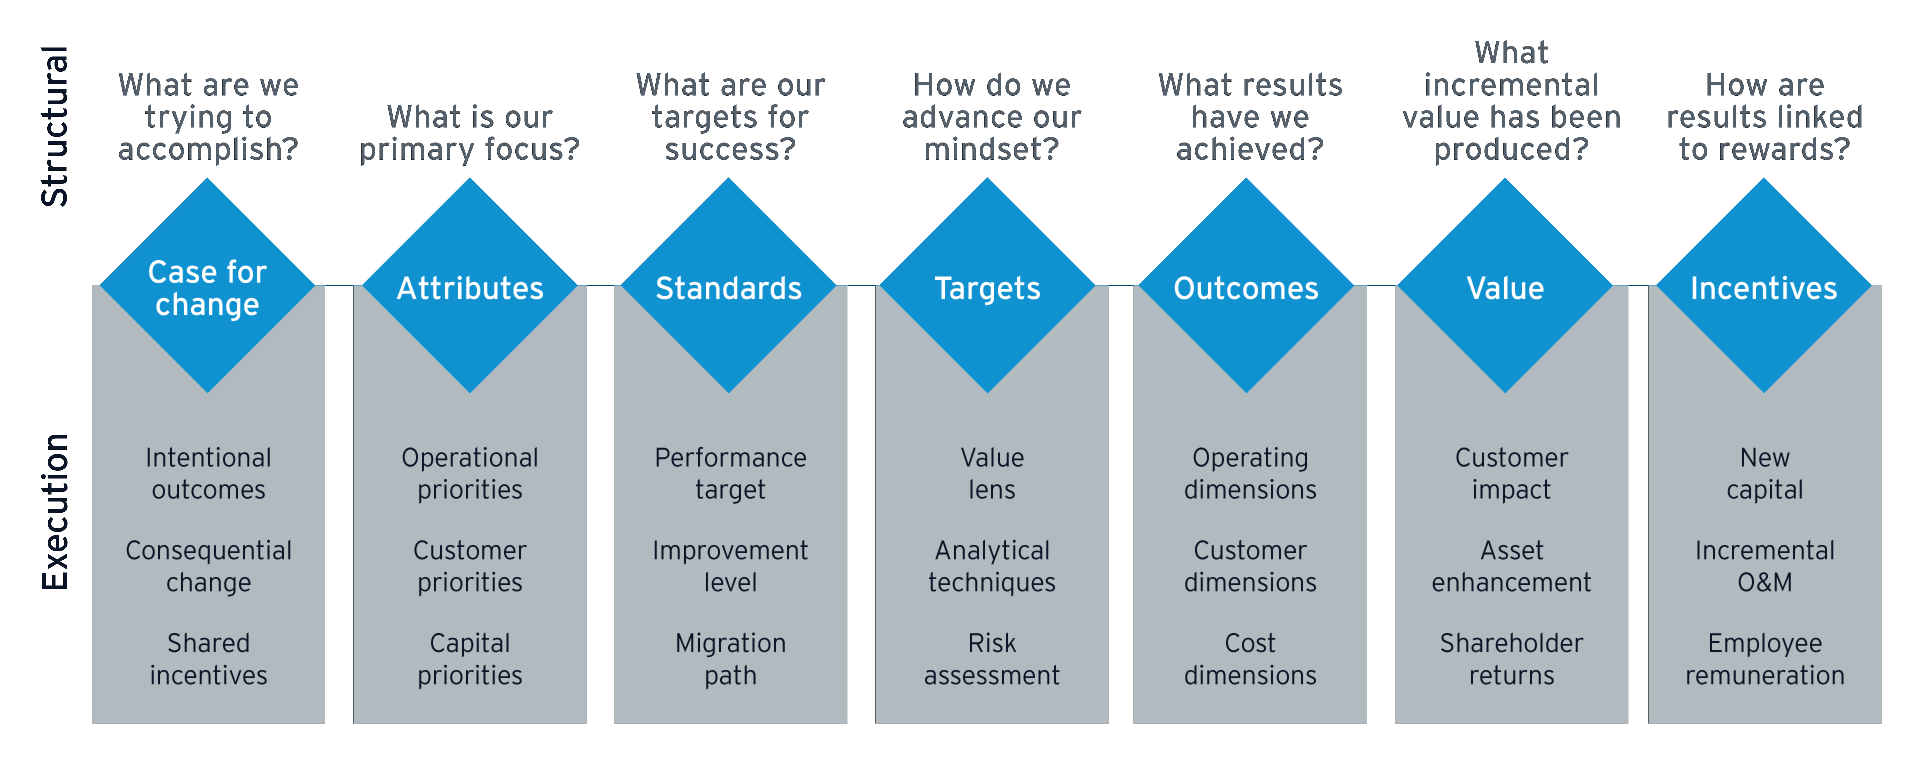
To be successful in pursuing the performance frontier, executives need clarity on purpose, progress, continuity, evolution, reporting and linkage to other internal and external mechanisms. Thus, adopting this model follows a straightforward progression from framing intent to translating results into rewards: (Figure – 5)
- Case for change: Develop a “case for change” to establish the need for radical rethinking of the purpose of cost take-out and service delivery improvement.
- Attributes: Identify attributes reasonably direct to measurable results, e.g., system reliability, project delivery, productivity improvement, customer connection, business innovation.
- Standards: Specify overall standards of performance to be realized within the attributes and the expectations for operating execution and improvement.
- Targets: Establish explicit targets to be utilized to measure period-to-period improvement and considerations to adjust for externalities.
- Outcomes: Define expected outcomes to be realized, the metrics used and bases for measurement across defined time periods.
- Value: Translate outcomes into tangible value created for customers and shareholders through the focus on cost elimination, service level enhancement and product introduction.
- Incentives: Align outcomes with internal incentives to recognize elevated returns, improved performance and enhanced execution with business and employee rewards.
Figure 5: Performance frontier building blocks
Performance frontier adoption
Pursuing the performance frontier questions the drivers of the significant traditional operating priorities, activities and entrenched cost pools to drive identification of alternative models to deliver capabilities to produce exceptional outcomes. It addresses whether certain capabilities are needed at all, analyzing value created for costs incurred, and identifying alternative performance enablers, such as digital thinking.
Most importantly, it challenges traditional utility operating norms, particularly decisions on “where” and “how” to invest, based on analysis of service levels, adoption of technology and digitalization and the level of operating risk tolerance. As management aligns on the “art of the possible” and determines optimal value investment levels to deliver desired performance outcomes, it can then articulate guideposts to move the business towards the performance frontier.
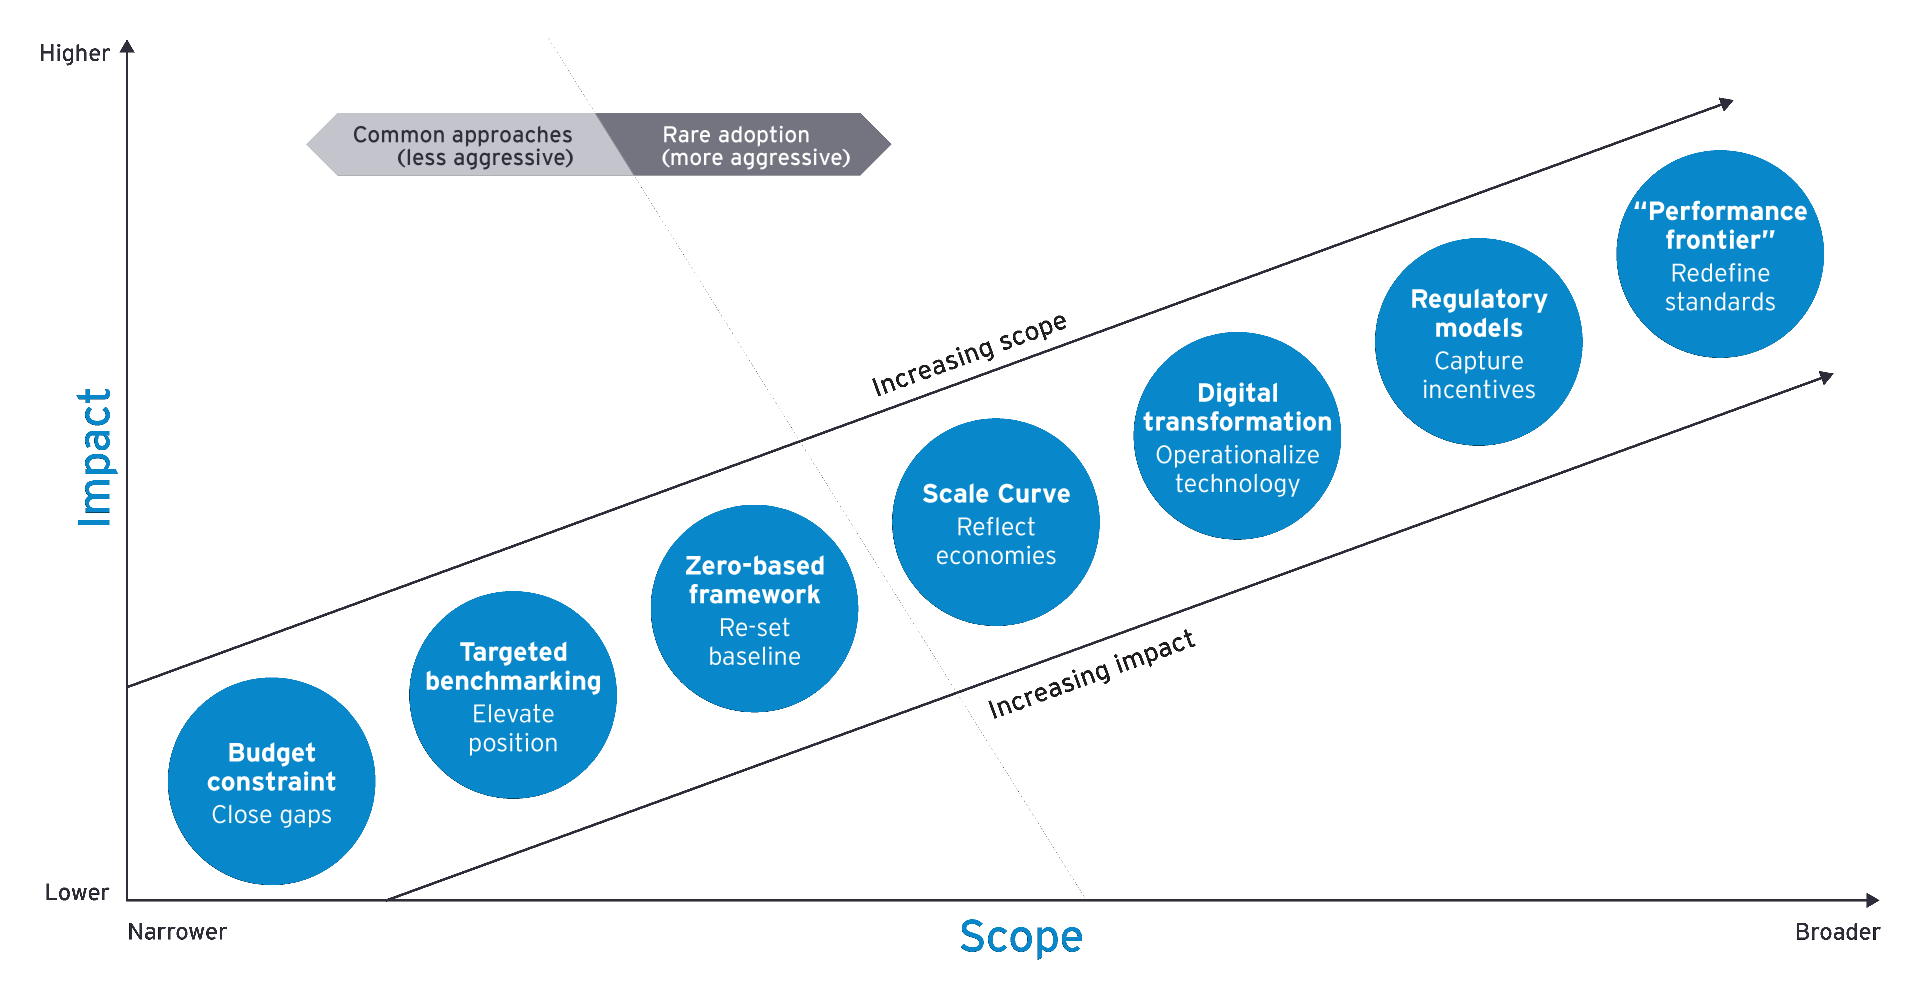
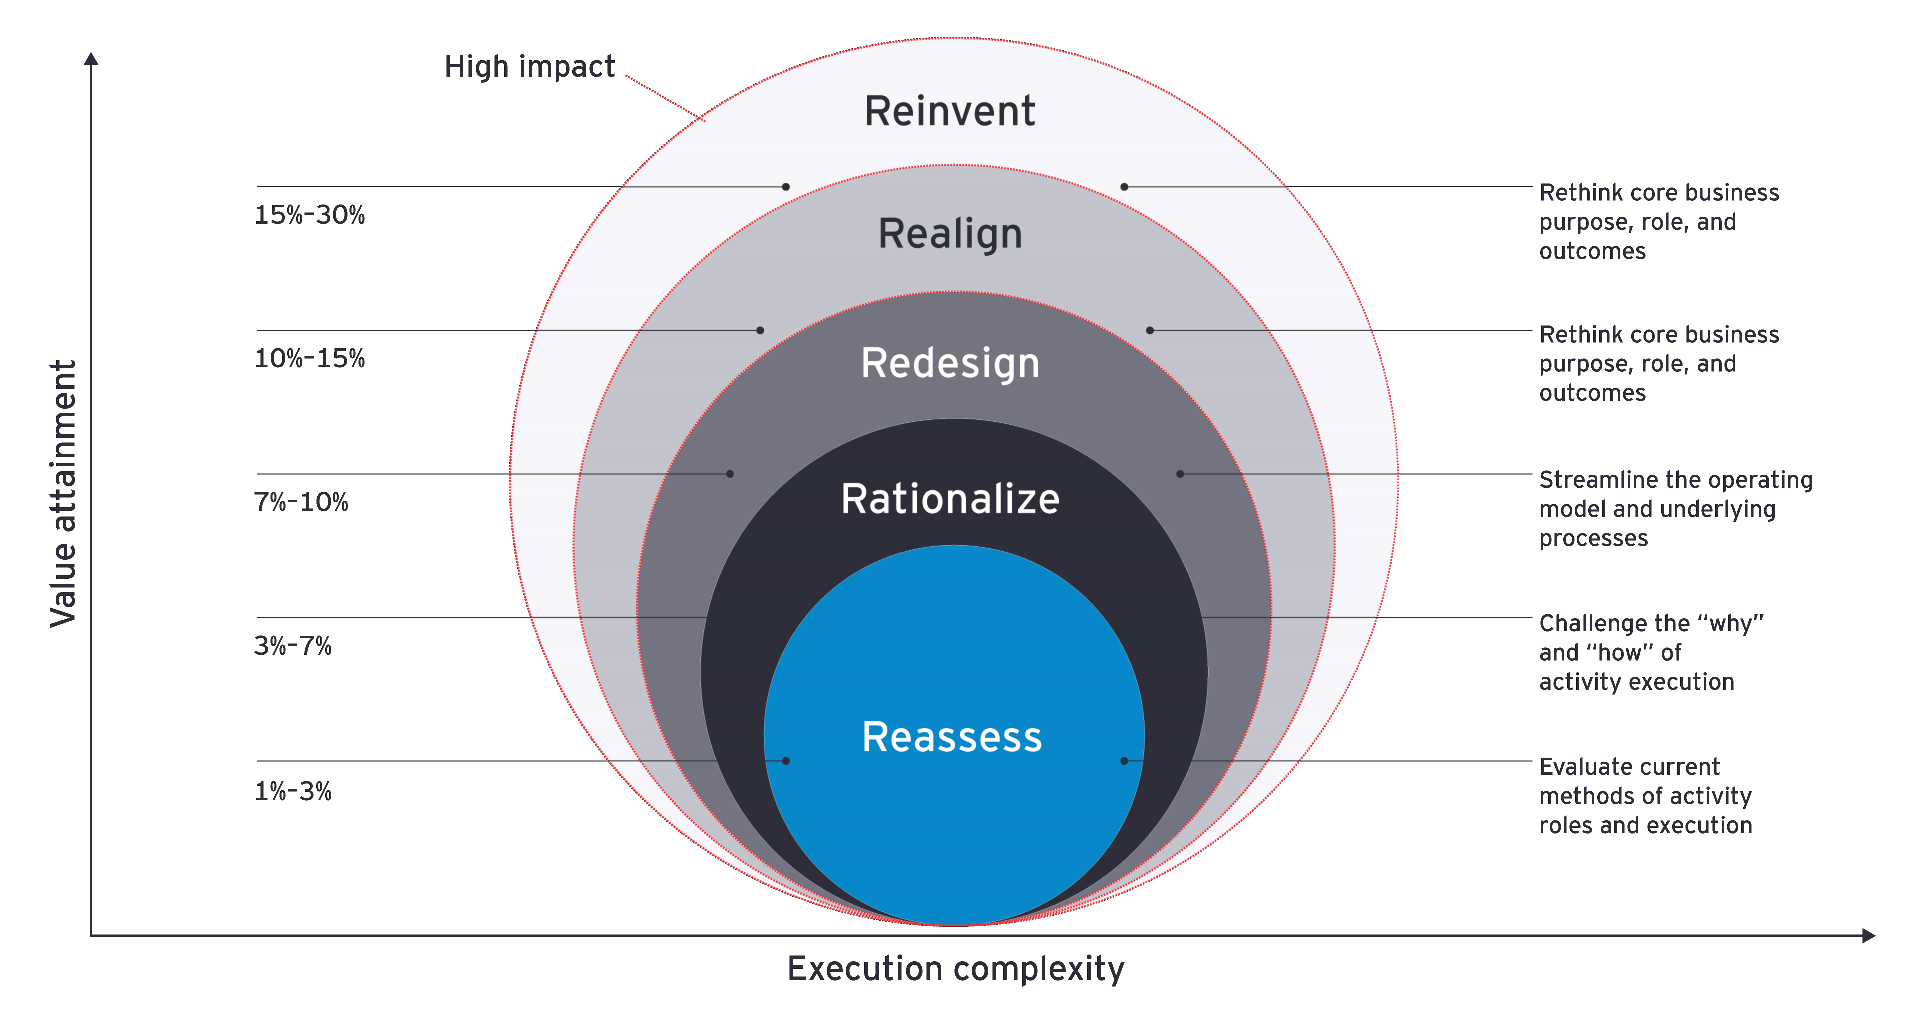
Adopting a performance frontier model turns traditional views of cost take-out and service improvement on its head to drive enterprise structural levers enabling outsized impacts, e.g., 15% to 30%, rather than quick, simple items, such as incurred costs, that struggle with 5% to 7% impacts. Executives open the cost aperture wider to more impactful value levers producing more dramatic operating results. Once identified, a utility then determines “how hard” to pull those levers based on outcome objectives and associated risk aversion. (Figure – 6)
Figure 6: The value of thinking differently
Cost management approaches

Chapter 4
The journey for utilities
Executives need to articulate business priorities, simplify the delivery model and embed a culture of sustained excellence.
Engaging the full enterprise in adoption of the performance frontier value journey needs visible and sustained executive leadership, recognizing employees and their experiences throughout the transformation. No effort of this breadth is accomplished without clear strategy and intent, since the journey is perpetual, not finite. This means the North Star must be visible, clear, compelling and future-oriented.
To successfully implement the performance frontier, a well-conceived “case for change” sets the strategic tone and operating path for the utility. The new tone and path develop new performance boundaries, define standards, describe outcomes, frame operating changes, align impacts and value, and link incentives. At the center of this model are the need to challenge the business to articulate its business priorities, simplify its delivery model and embed a culture of sustained excellence.
If future customer price increases are to be effectively constrained, and value to customers and shareholders increasingly demonstrated, creative and aggressive actions need to be adopted across utilities; continuing the status quo only limits development of the industry and heightens risks to securing customer affordability.
Summary
The option taken by utilities to achieve significant cost reduction matters: Simple approaches produce incremental results, while more imaginative models deliver transformational outcomes. With the energy transition creating continuous pressure on cost levels, creativity underpins outcome realization of meaningful effects on customer affordability and service levels.
