How the Full Potential Paradigm™ can help CEOs achieve long-term value
Using our data-driven analysis, CEOs can derive actionable insights to help their business reach its full potential.
A
well-defined company strategy creates value and is properly connected with the rest of the enterprise. It needs to answer questions, such as:
- Portfolio optimization: Which of our businesses should we continue to own? Which should we divest? What gaps do we need to fill through building, buying or partnering?
- Capital allocation: How much should we invest organically in each of our businesses? What can we afford to pay for acquisitions?
- Valuation: Which of these alternatives do investors favor? What strategic moves could increase our intrinsic value and market value, and reduce the gap between them?
To highlight the kinds of rigorous analyses you should perform to help make these kinds of strategic decisions, we often use a diagnostic tool kit we call the Full Potential Paradigm™ (FPP). FPP can help in setting operational targets, informing portfolio strategy and understanding investors’ value drivers.
A good strategy starts with setting the right targets
Reaching your company’s full potential involves understanding the various paths to maximizing value and starts with setting a data-driven strategy. One of your most important roles as a business leader is to establish realistic and achievable goals to guide decisions around choosing what markets to compete in and how. You need to identify and set these targets through a fact-based approach to analyzing what levels of profitable growth and sustainable margins are achievable. This effort employs certain universal concepts — such as business definition, relative market share (RMS) and competitive dynamics — that are relevant across industries and companies of all sizes.
FPP is a proprietary framework with four complementary elements that help illuminate part of the “Which targets should we set?” question:
| 1. | Market context |
|
| 2. | Margin performance |
|
| 3. | Growth opportunities |
|
| 4. | Investor alignment |
|
In today’s dynamic and disruptive competitive environment, what CEO doesn’t need to know the answers to these questions? And what CEO has solid quantitative answers to these questions in which he or she has a high level of confidence?
To set the stage, it is important to understand that FPP is based on what we call “maniacal realism.” This term represents our commitment to questioning assumptions and conventional wisdom in search of driving insights about a business.
Defining market context
Defining market context is a critical first step to help ensure your strategic goals fit your business and industry. This exercise identifies the specific industry and competitors, as well as growth and profitability drivers, and answers these questions:
- Is the industry consolidated or fragmented? Is it consolidating, fragmenting or stable?
- What is the basis for competition?
- Where are the boundaries of your industry under attack?
- What are competitors’ market shares and how are they changing?
Defining your business is often not as straightforward as it sounds, given all the transformation and disruption in the world today. Business definition takes into account both your business today and where it is headed, starting with a clean slate and not relying on conventional assumptions. The analysis looks at customers, current competitors and costs to identify peers and competitors.
Understanding the value chain remains the core requirement, even though value chains have become increasingly complex, shared and digitized.
1. Mapping your market
An important first step is to create a Market Map of your business’ position within its industry that shows individual companies’ participation across segments, as well as the level and type of competition. Figure 1 maps the global beauty market at a recent point in time and shows the breakout of total industry sales by segment: skin care, hair care, cosmetics and fragrances. Along the vertical axis are the individual market participants within each segment as a percentage of revenue. Each box on the chart represents a competitor’s revenue in a segment.
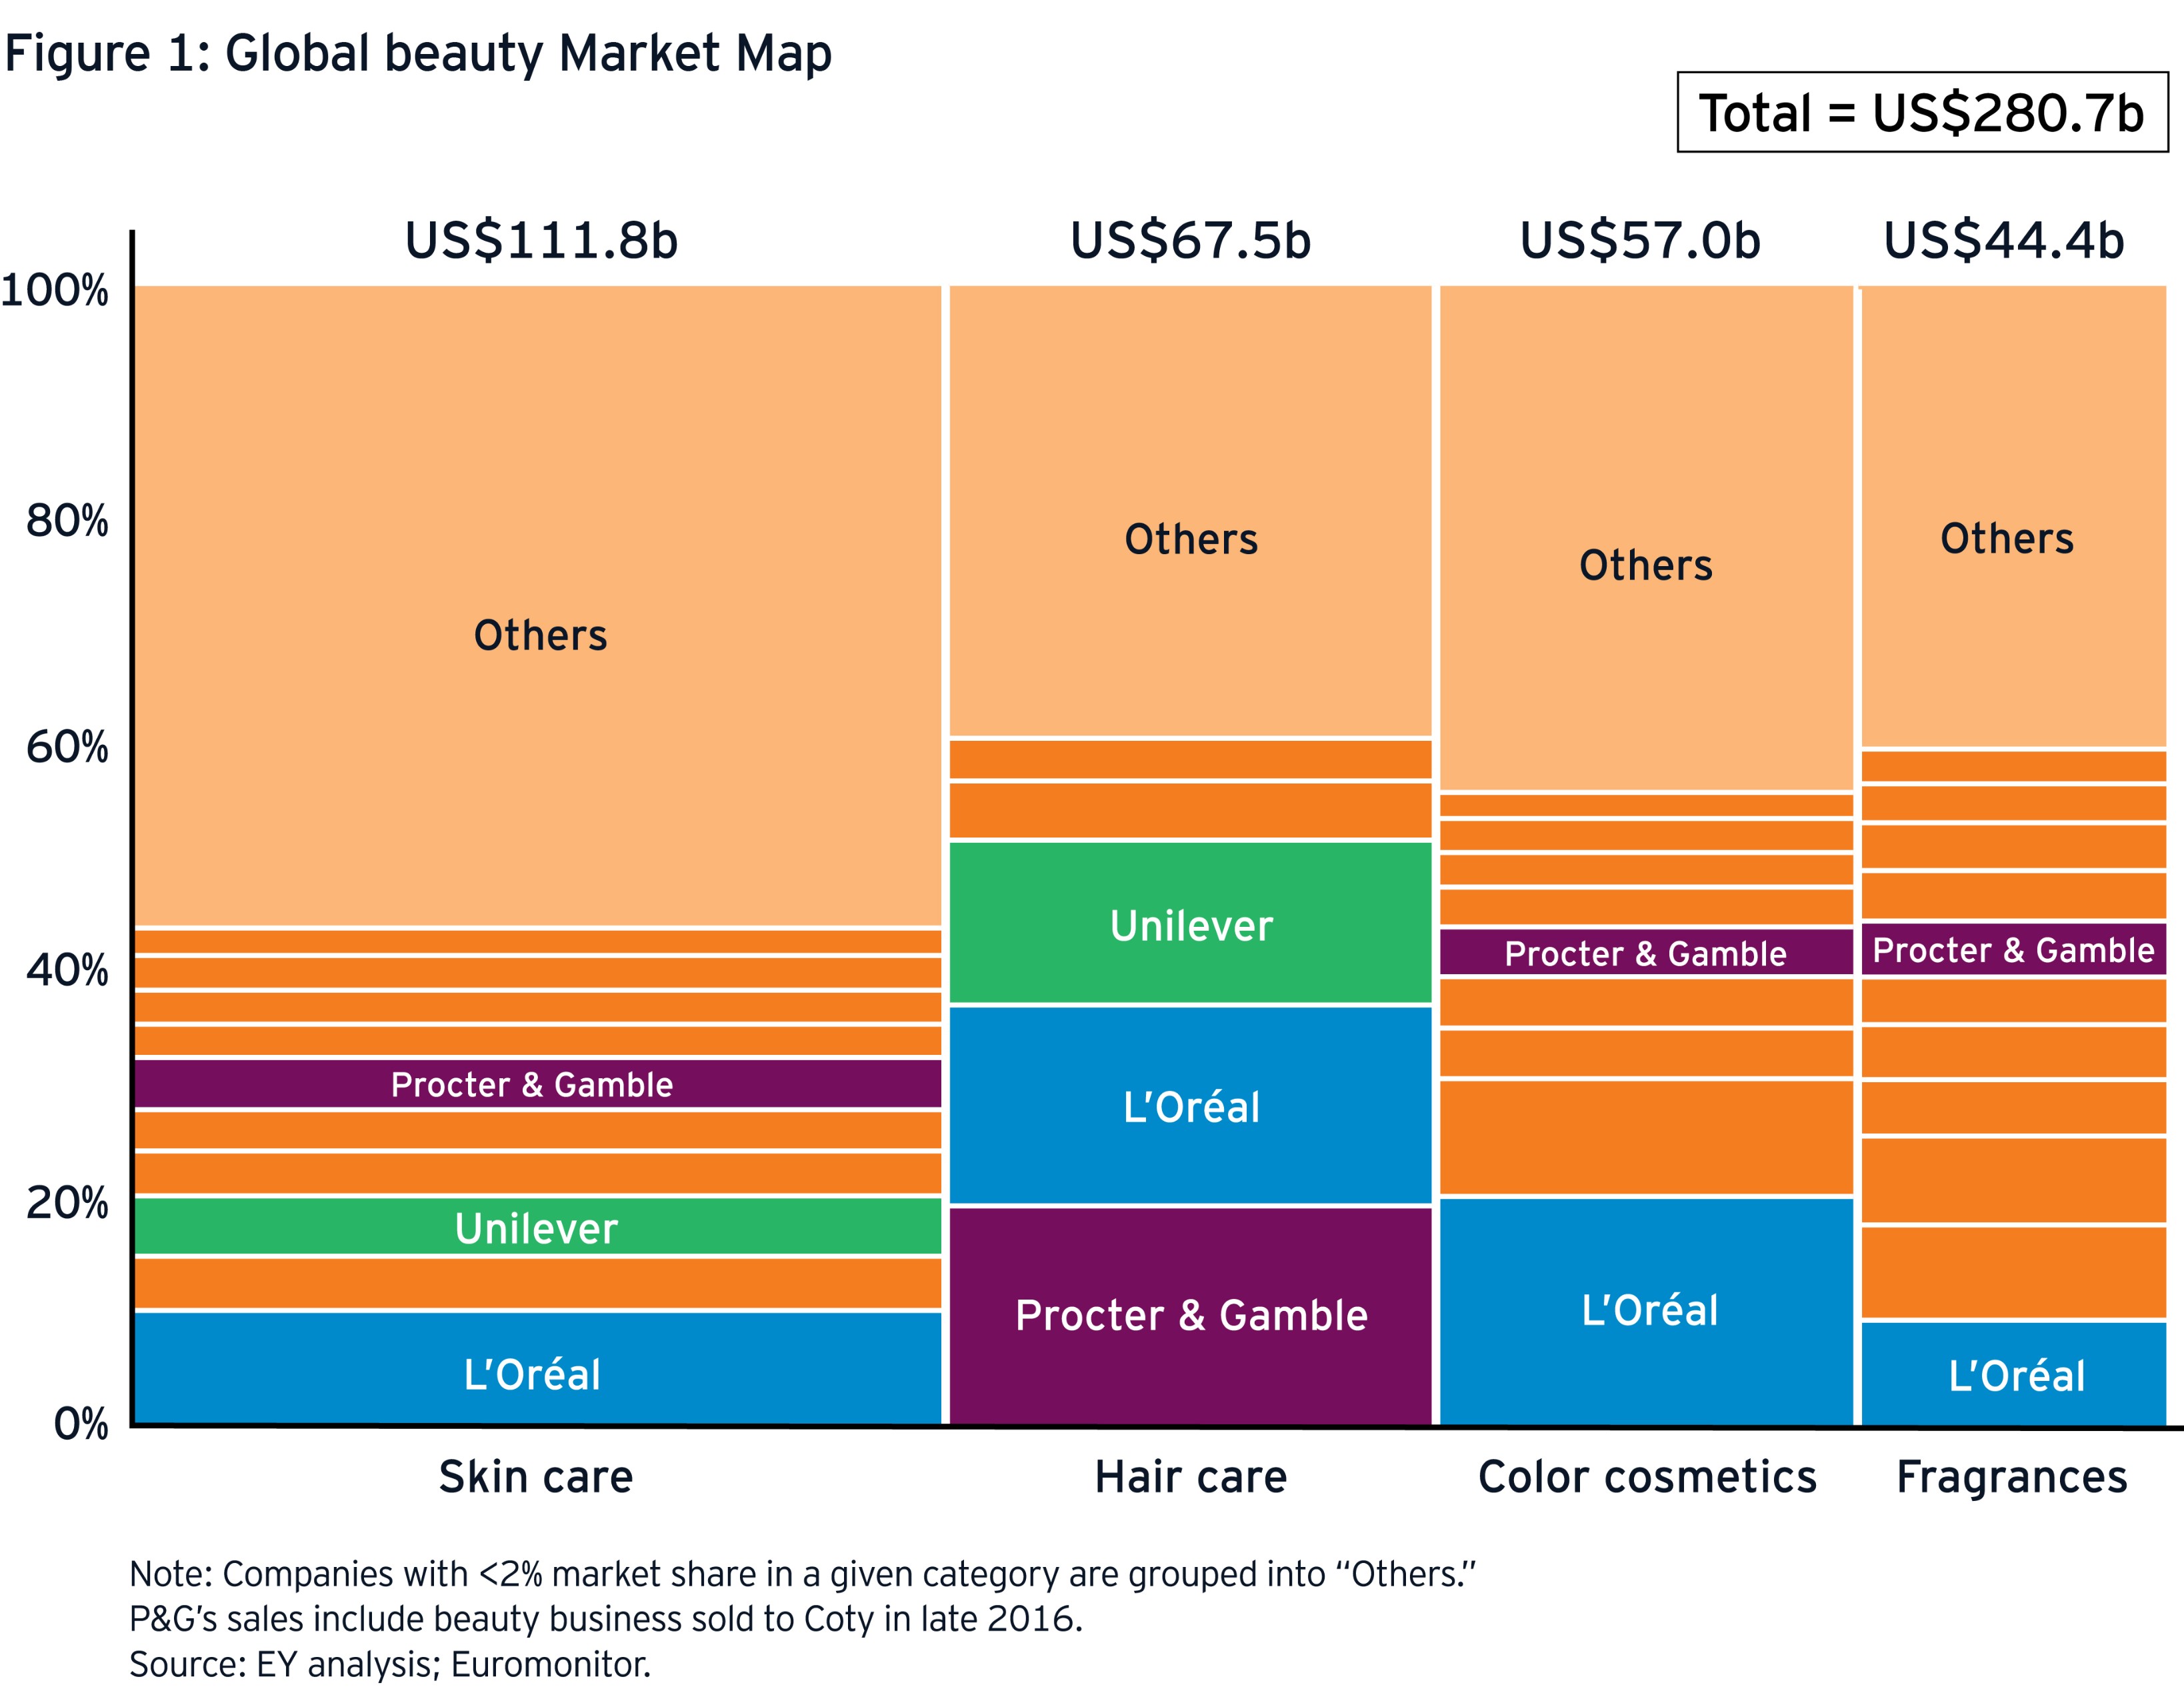
We can make specific observations and formulate questions to help advance the analysis:
- Does segment market share appear to correlate with profitability?
- Are there smaller competitors that have good profitability? Why?
- What are the benefits of playing in multiple segments?
- Which acquisitions and segment divestments could create the most value?
Further segmenting the market (such as by geography or by men’s and women’s beauty or grooming) might generate more actionable insights. A full FPP process would determine what level of detail is sufficient, and in practice we suggest continuing until the story doesn’t change.
2. Setting margin targets using the Performance Gap
A Performance Gap analysis examines a company’s market position to help develop a rigorous understanding of achievable margins and alternative paths for reaching them. On the way to setting operating margin targets that are aspirational but achievable, you should be able to answer these questions:
- How is profitability driven by our market position?
- Does being a market leader limit our profitability?
- How do we determine if our performance is sustainable?
For a properly defined business, profitability is driven by RMS, so companies with high RMS should, all else being equal, earn more than those with lower RMS. This is derived from and similar to the experience curve.
Our research spanning more than 30 years shows that this relationship holds for both cost efficiencies and pricing advantage. In fact, high RMS does not tend to limit revenue growth, which debunks the notion that companies may be “too big to grow.”
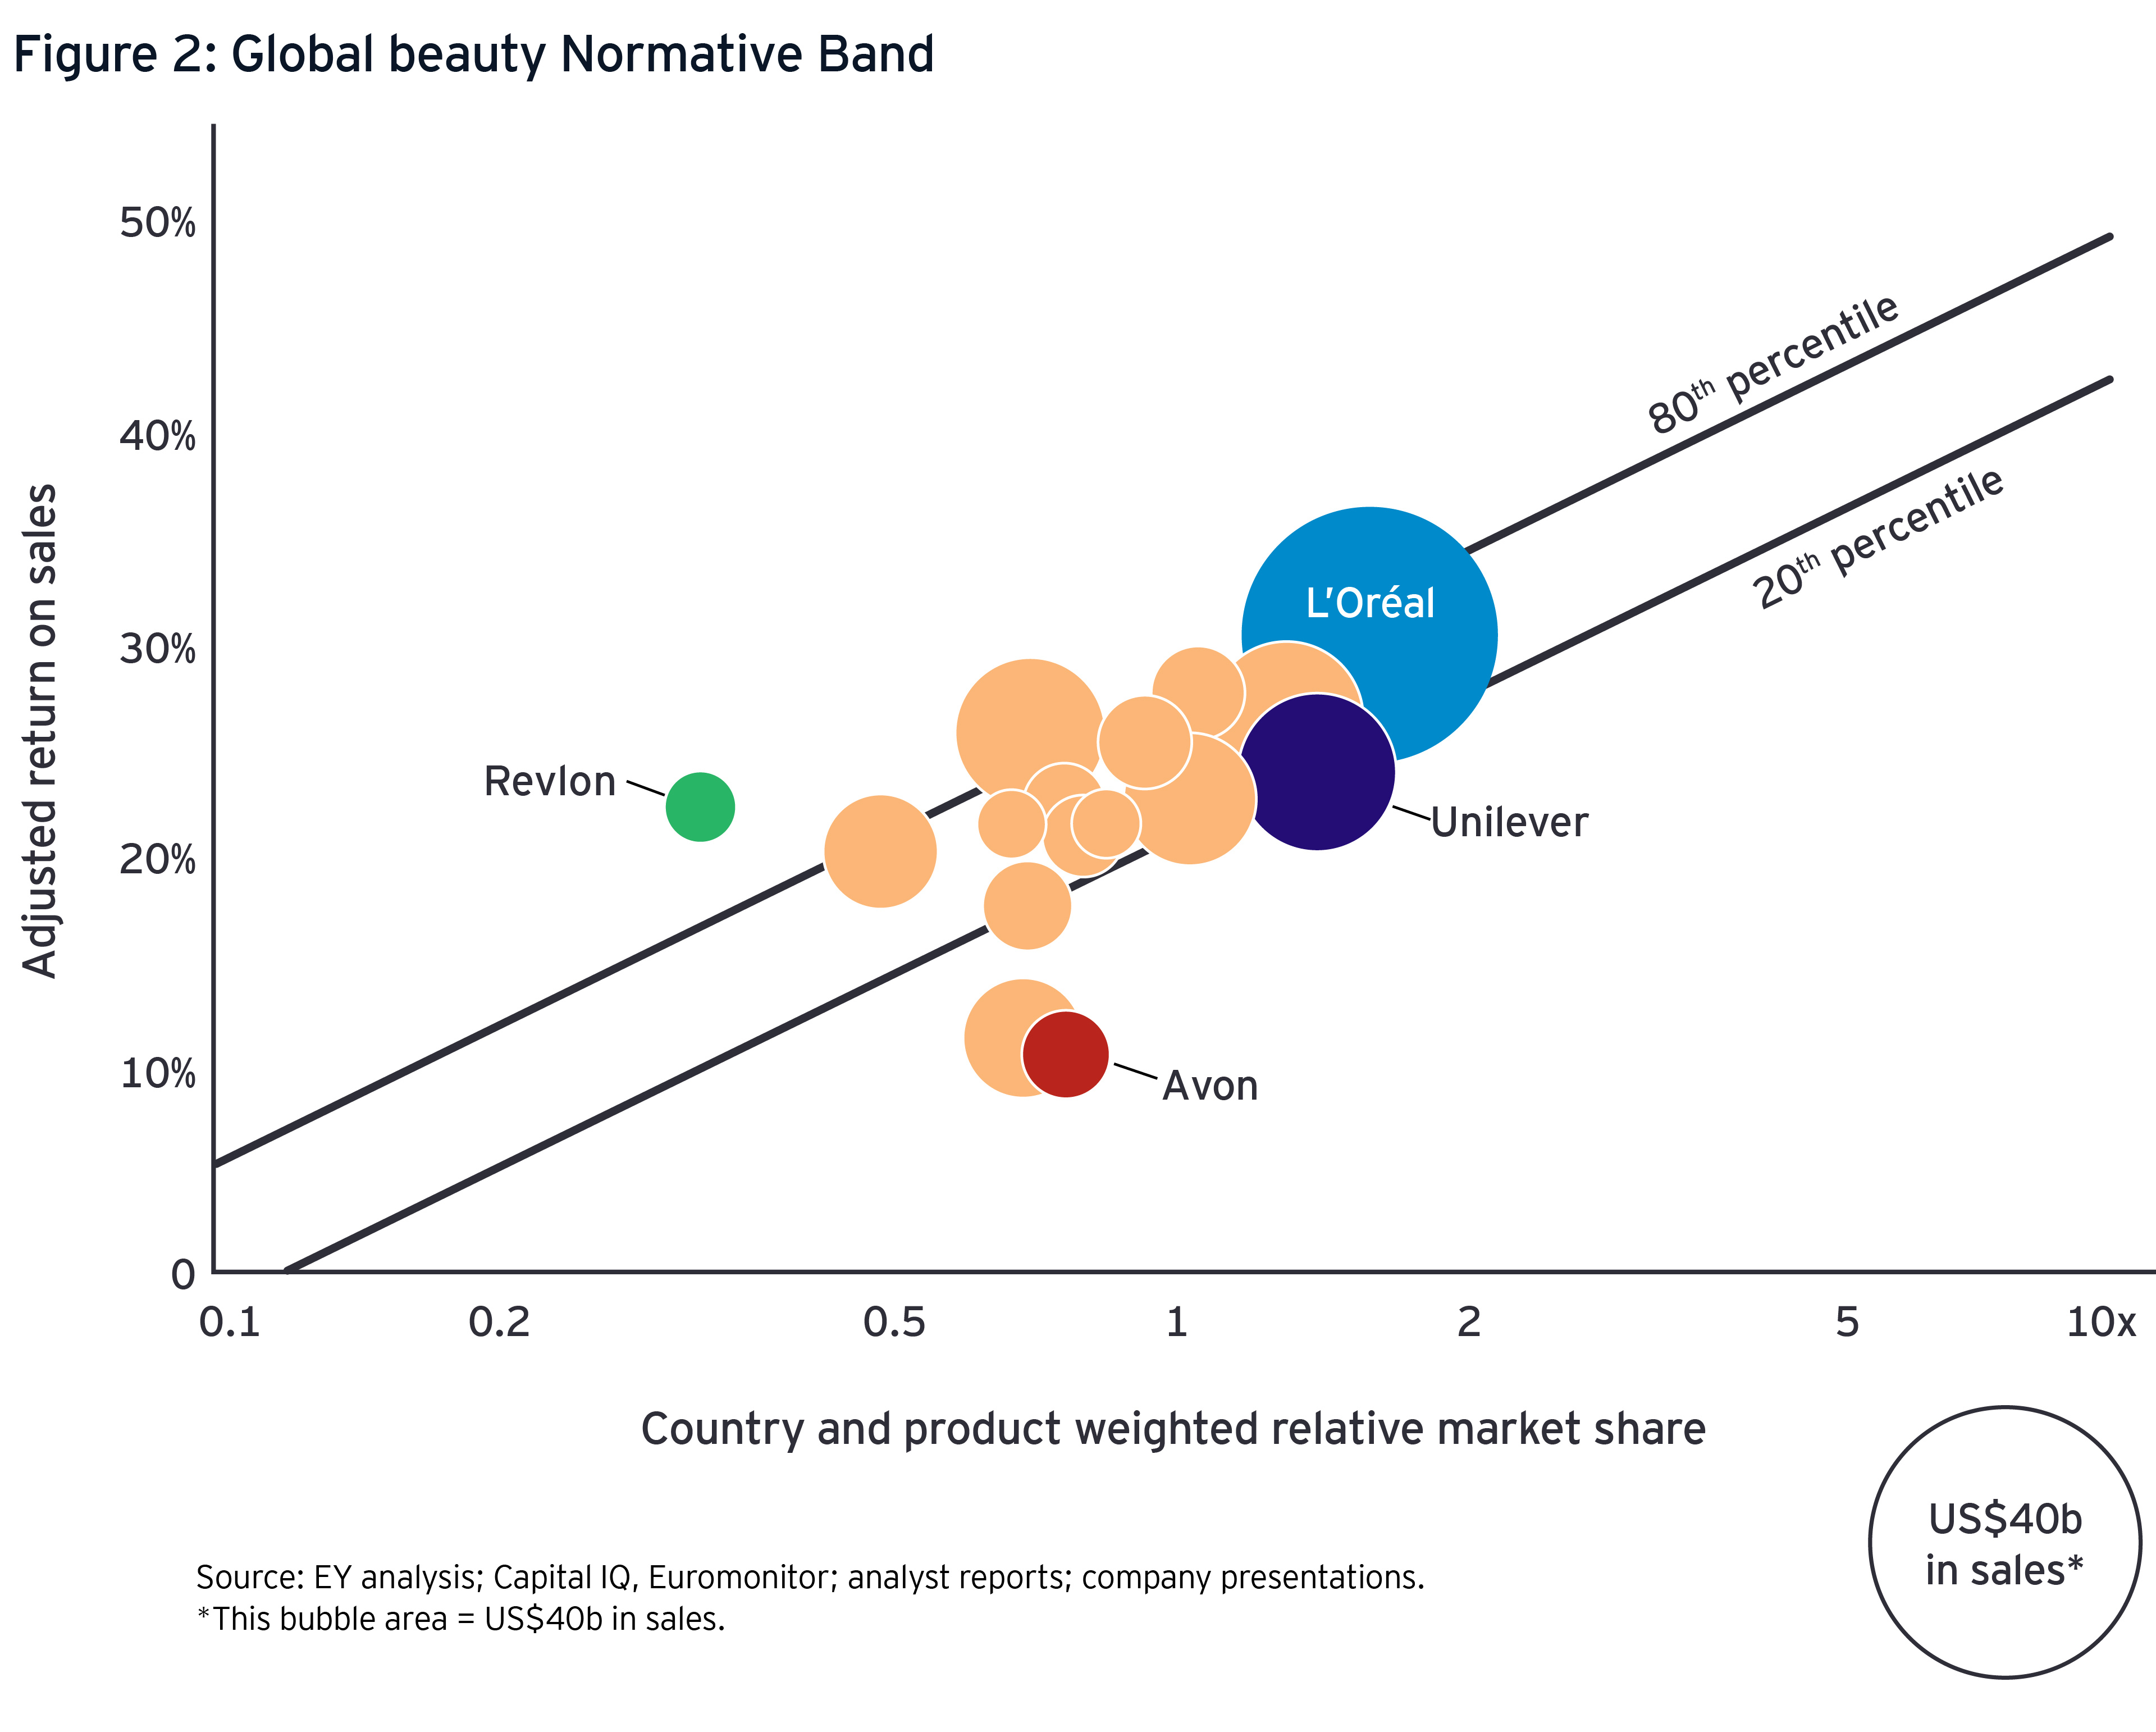
Figure 2 is a diagnostic tool we call the Normative Band, which highlights where a company’s profitability is on track, outperforming or in need of improvement. Here we continue to look at the global beauty retail market.
- The first thing you notice is that the firms are highly clustered between 0.5 RMS and 2 RMS, and only one competitor is above the 80% band — the optimal performance. In other words, there are many players with middling margins, indicating a market that may be unstable and ripe for M&A-driven consolidation.
- Further analysis would be required to determine why Revlon is able to have significantly higher margins at significantly lower RMS.
- Is Avon’s profitability low because of the cost of direct selling?
Based on where your company lies relative to the Normative Band (between the 20th and 80th percentile lines), there are multiple levers you could pull to reposition by moving up (more profitability) and to the right (greater market share). These potential strategies include acquisitions, divestments and operational improvements to help achieve sustainable margins.
3. Setting growth targets with the Opportunity Gap
Where the Performance Gap focuses on business as it is today, the Opportunity Gap analysis shifts that focus to what could be — asking managers to look outside the box, albeit not necessarily very far outside, and often in someone else’s box. The analysis works by identifying strategic opportunities that require further organic investment, while also identifying M&A and divestment prospects.
This analysis helps answer the following questions about resource allocation and transaction execution:
- Am I over- or underinvesting in any of my businesses?
- Which of my businesses would benefit most from M&A?
- Are there businesses within my portfolio that are divestments candidates?
The Opportunity Strength Matrix (OSM) compares a business’s strategic position to the opportunities available to that business. The notion of comparing strategic position to opportunity is as old as strategy consulting itself. The OSM builds on perhaps the best-known chart in strategy consulting, the Boston Consulting Group’s venerable Growth Share Matrix1, which uses a business segment’s growth rate as a proxy for its opportunity. Now, decades later, companies can access much richer sources of information and sophisticated analytical tools to better assess market opportunity. The OSM example in Figure 3 replaces the growth rate with a more predictive, industry-specific “opportunity attractiveness.” Among the factors that can now be incorporated:
- Industry maturity based on adoption curves
- Investment flows in converging industries that may be early indicators of disruption
- Geographic segments with premium price points — for example, in consumer products
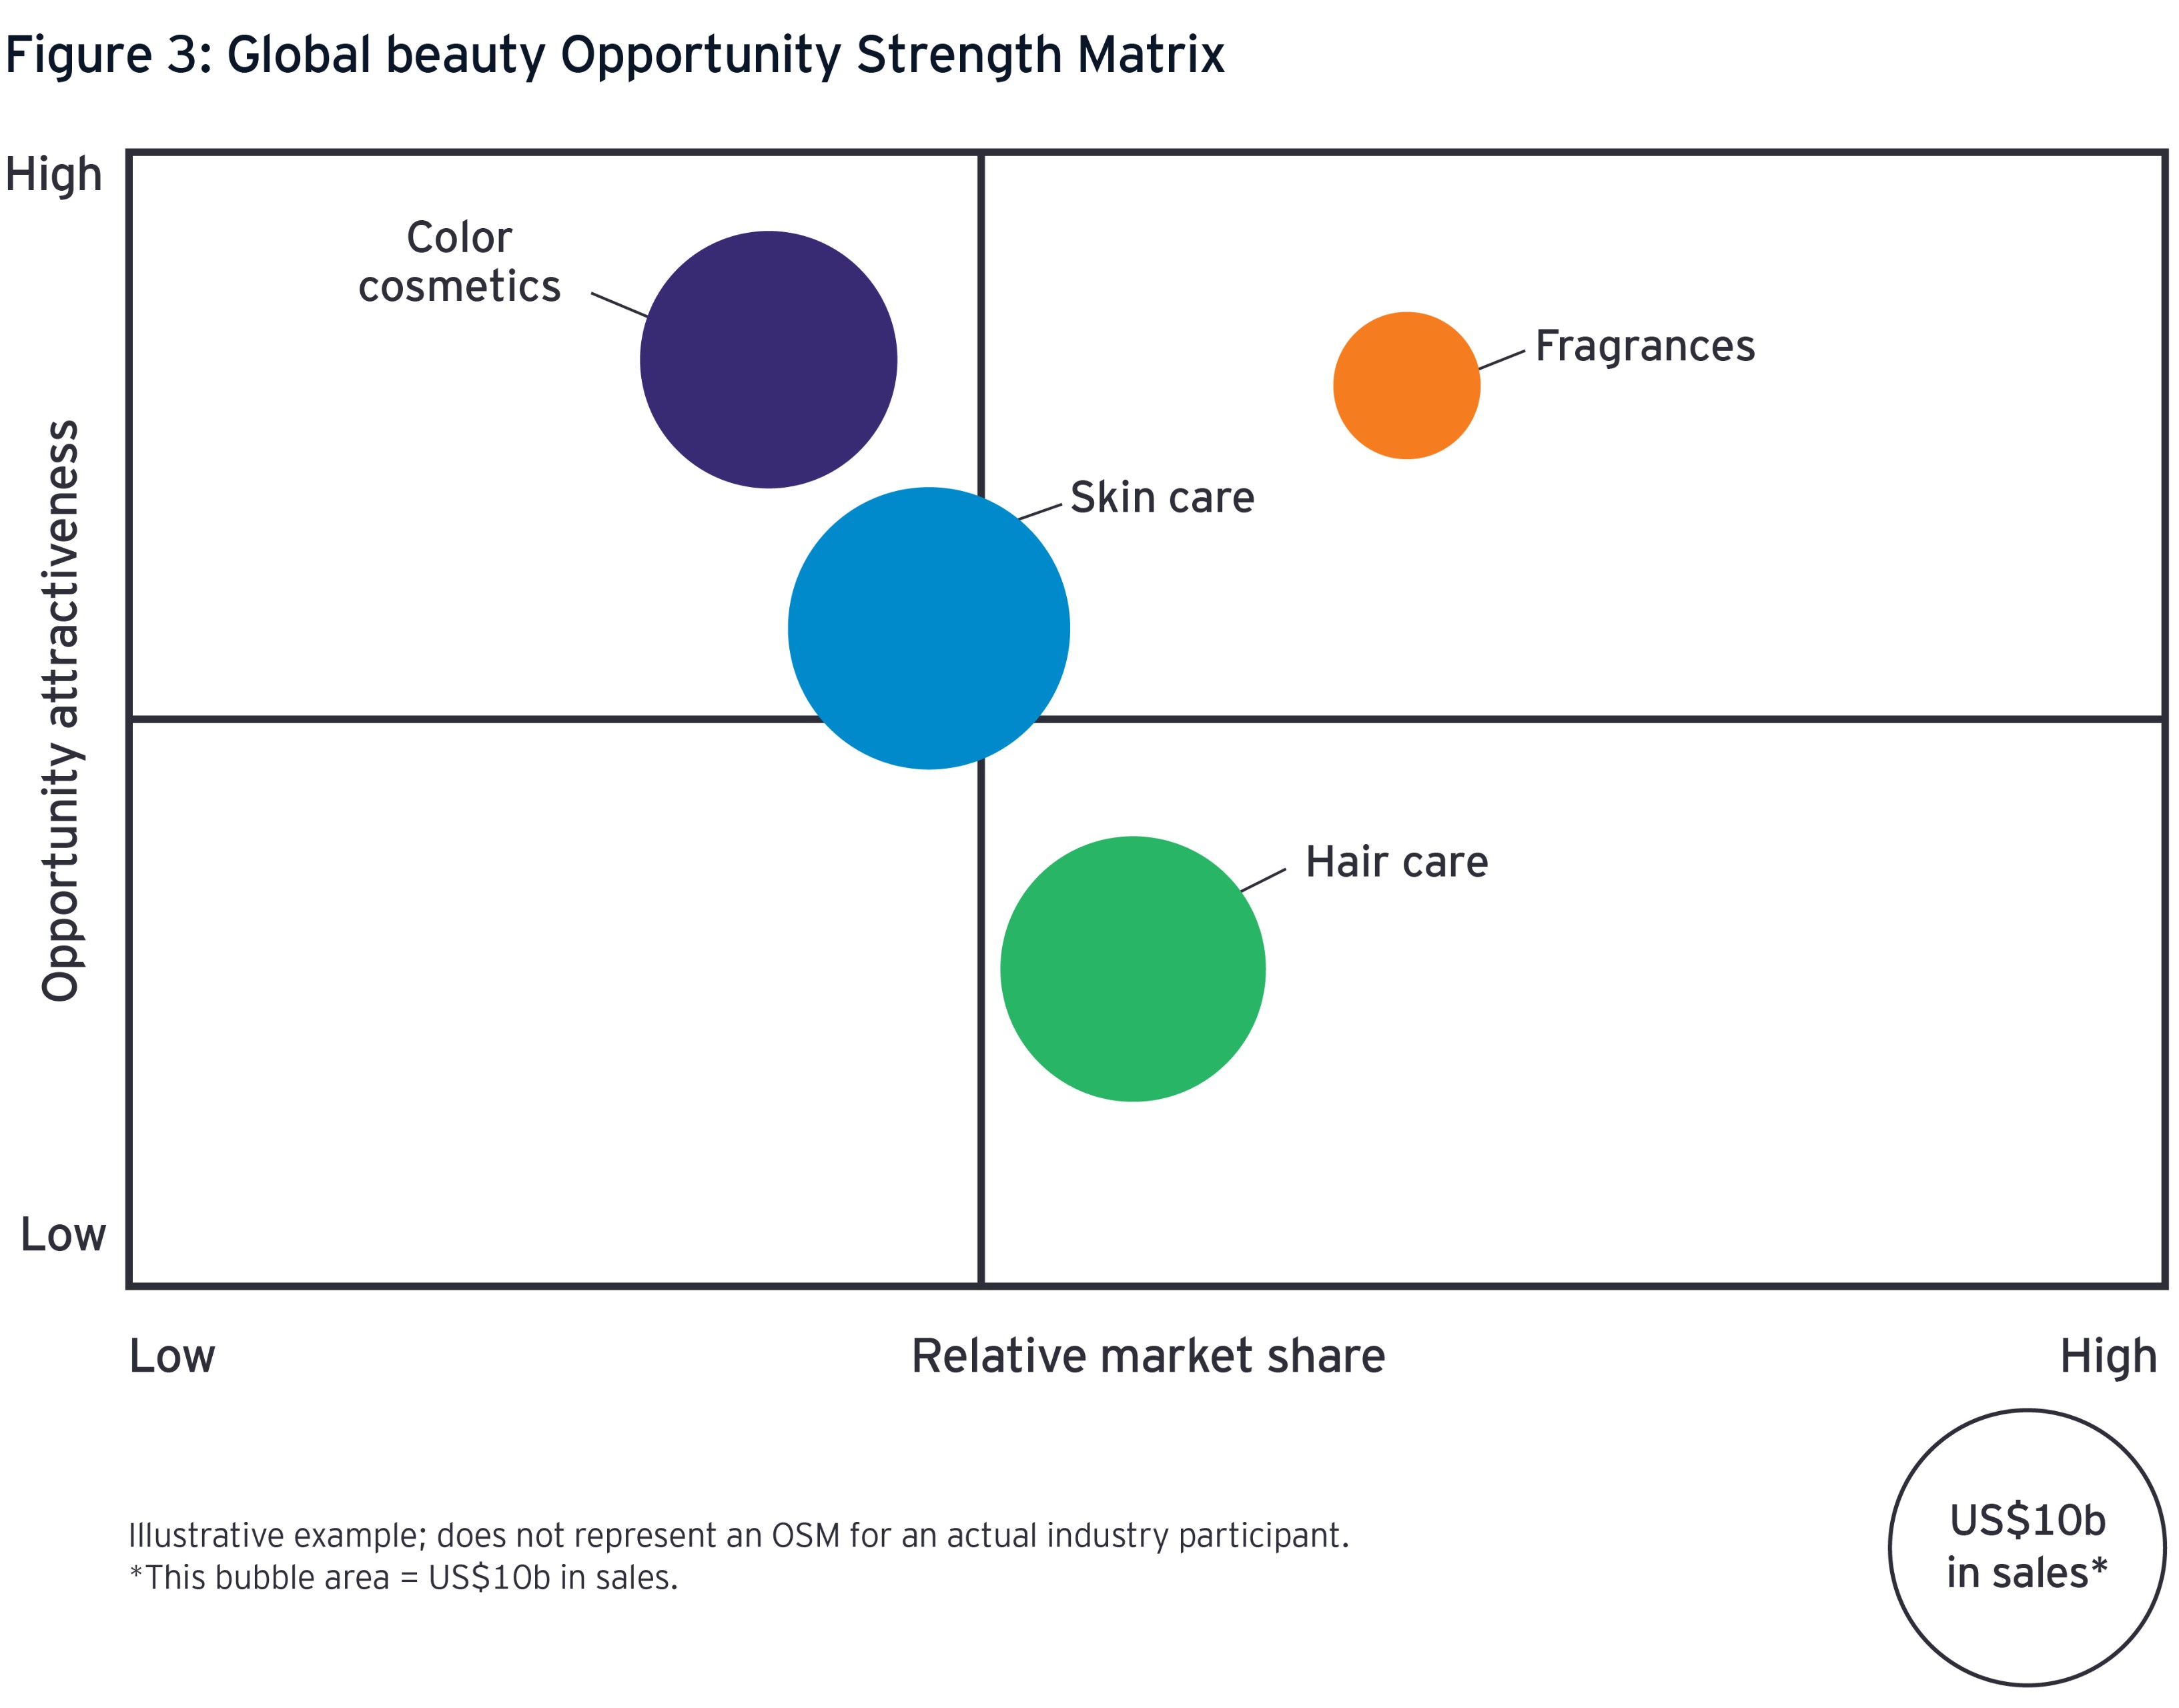
Figure 3 shows that color cosmetics appears as both a current strong competitor and a compelling growth investment. Interestingly, in a traditional growth share matrix, color cosmetics would be least attractive based on their historical growth rate. Conversely, the hair care segment is clearly the least attractive based on the OSM analysis, though its growth rate would be equivalent to the other three businesses.
4. Aligning with investors via the Perception Gap
The Perception Gap uses regression models to deconstruct a company’s market valuation to help align operating targets with investors’ perspectives. Market participants rarely reveal all the factors that go into their stock valuations, so this analysis enables management to prioritize resource allocation and deploy capital more in sync with investor priorities. For example, if the company could improve both revenue and margin but the Perception Gap analysis suggests that margin is a more important market value driver, then that’s where management should focus more of its efforts.
The Perception Gap part of the FPP diagnostic supports answers to the following questions:
- Which controllable variables influence market value?
- What is the relative effect on valuation of each of these variables?
- Are our communications with the market in line with expectations and our performance?
Figure 4 summarizes a Market Value Drivers analysis looking at various contributions to a company’s market capitalization.
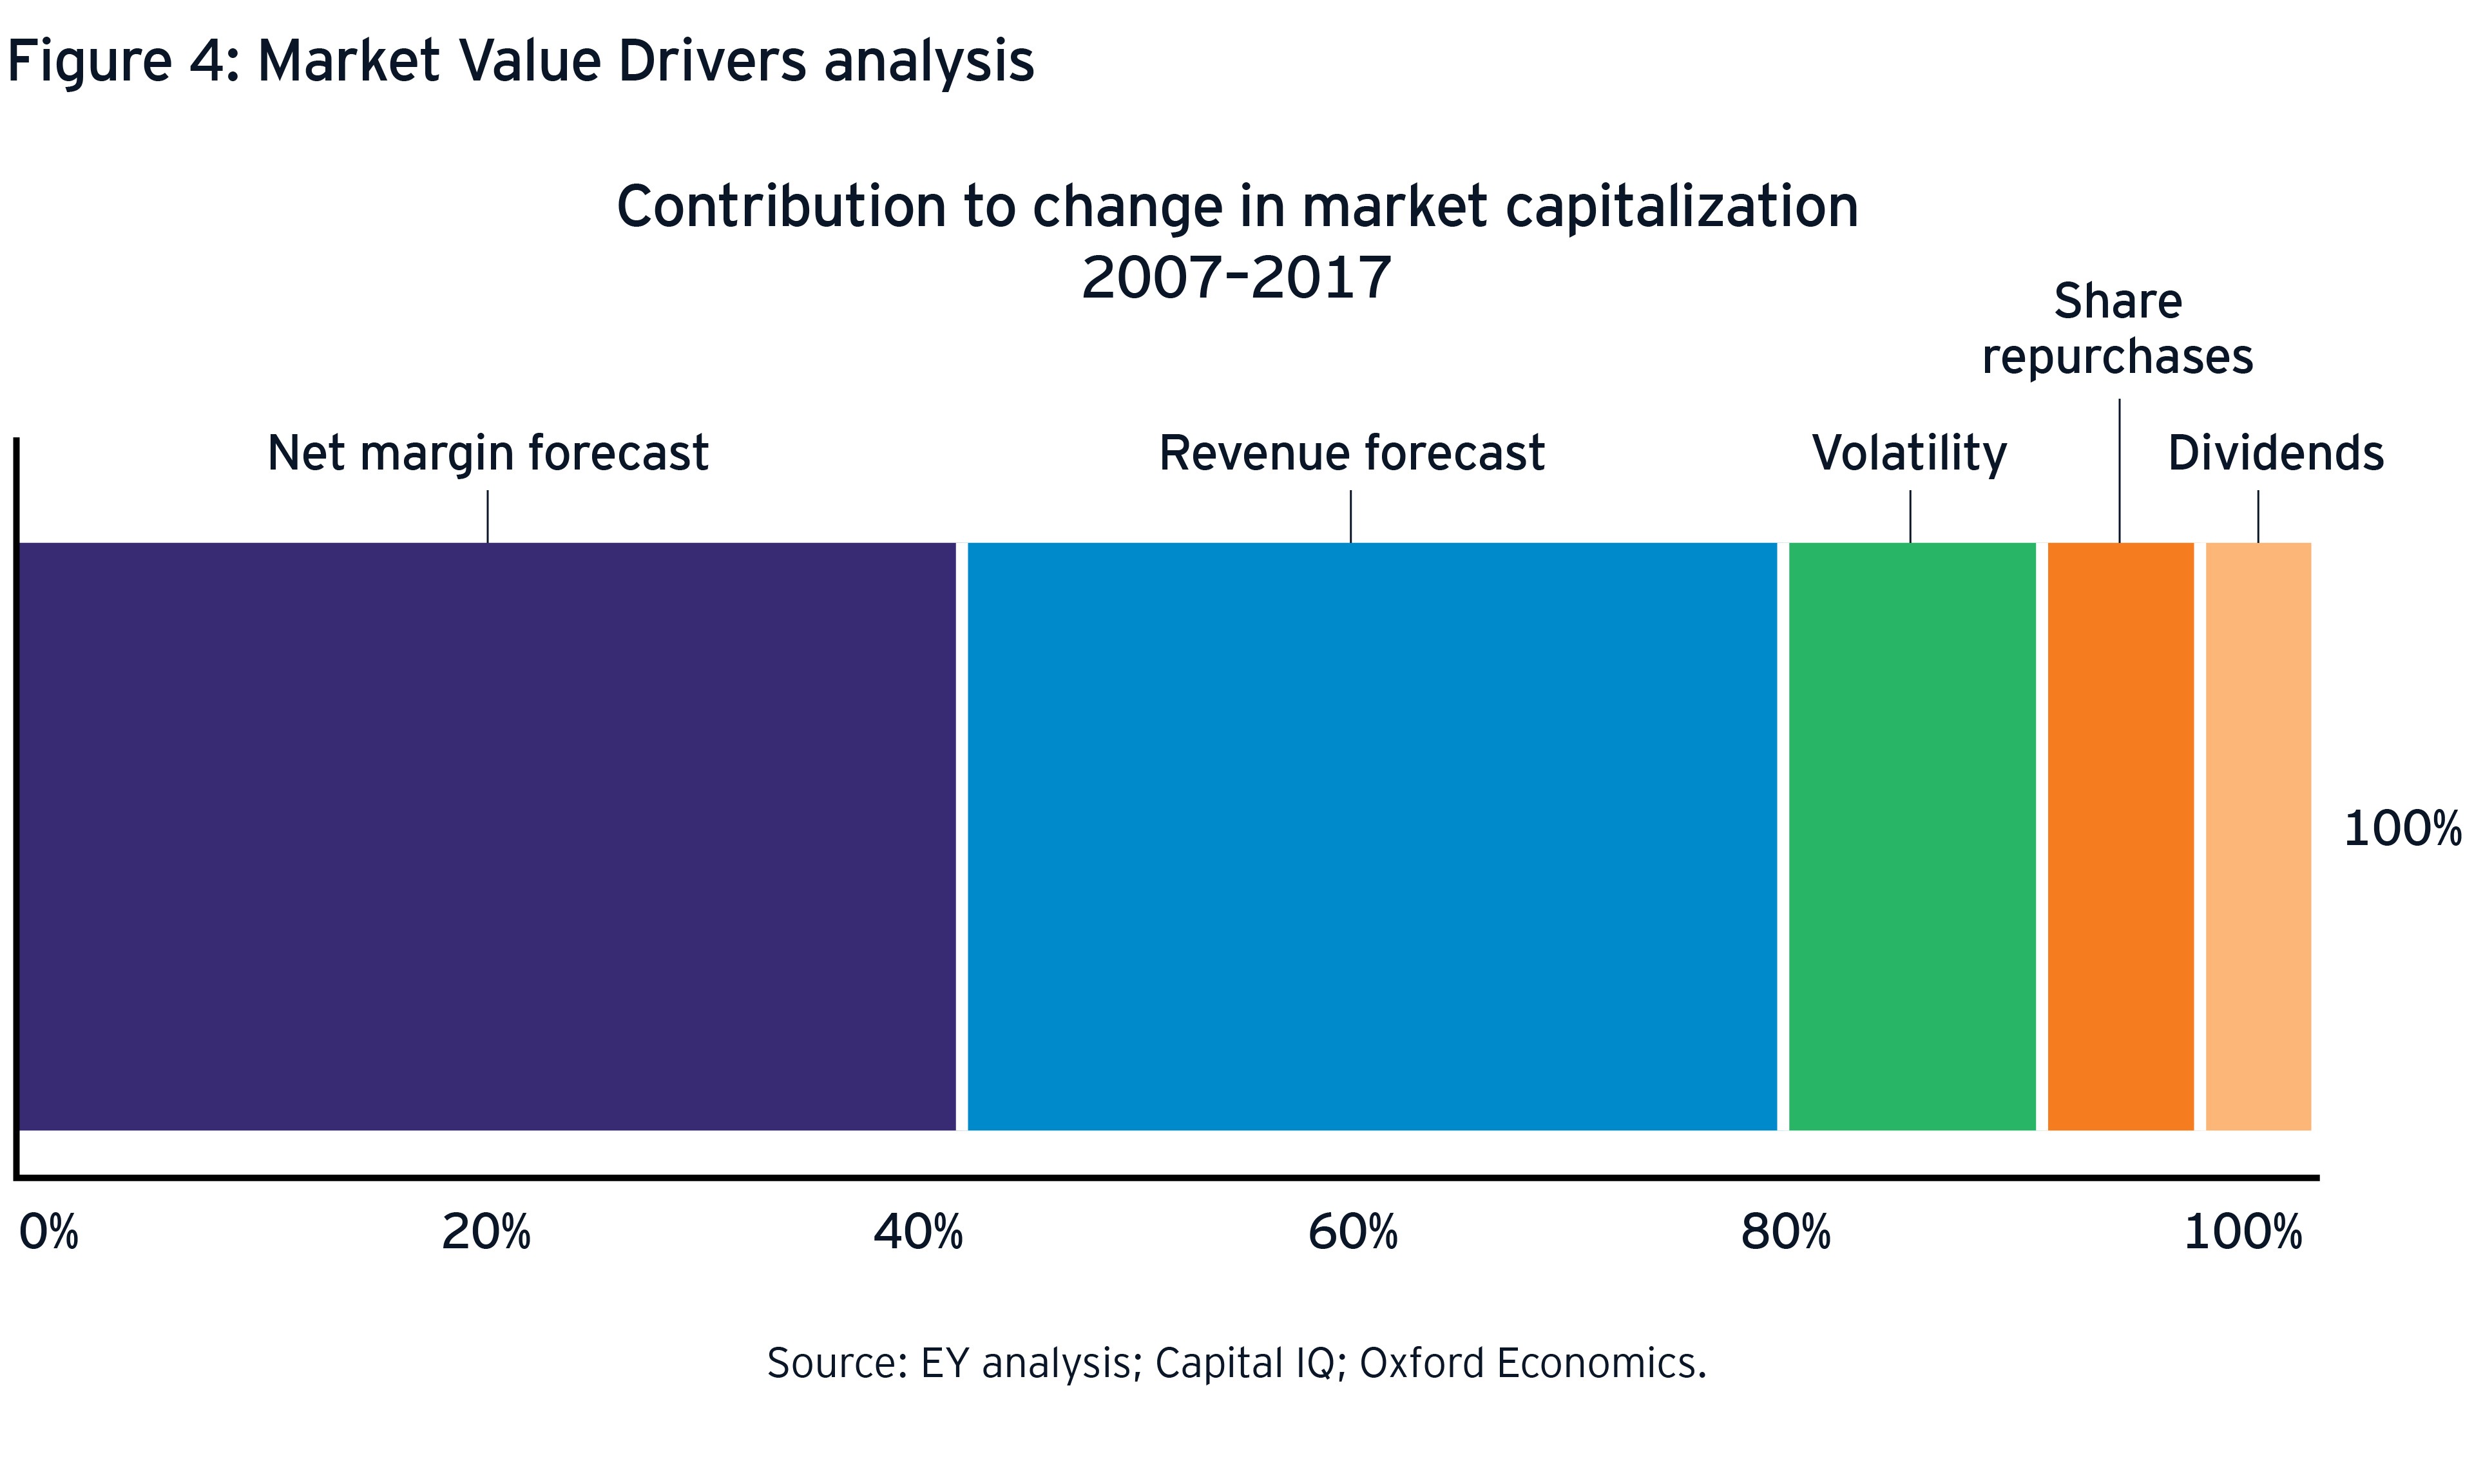
Underlying the calculation is a sophisticated regression model that incorporates both company-specific and industry-wide variables.
Based on these results, if you were a board member or CEO, you would recognize that growth has historically been highly valued by the marketplace in the form of either revenue or margin over the long run. Therefore, assuming the same relationships hold into the future, focusing on shareholder payouts over profitable growth would not maximize value.
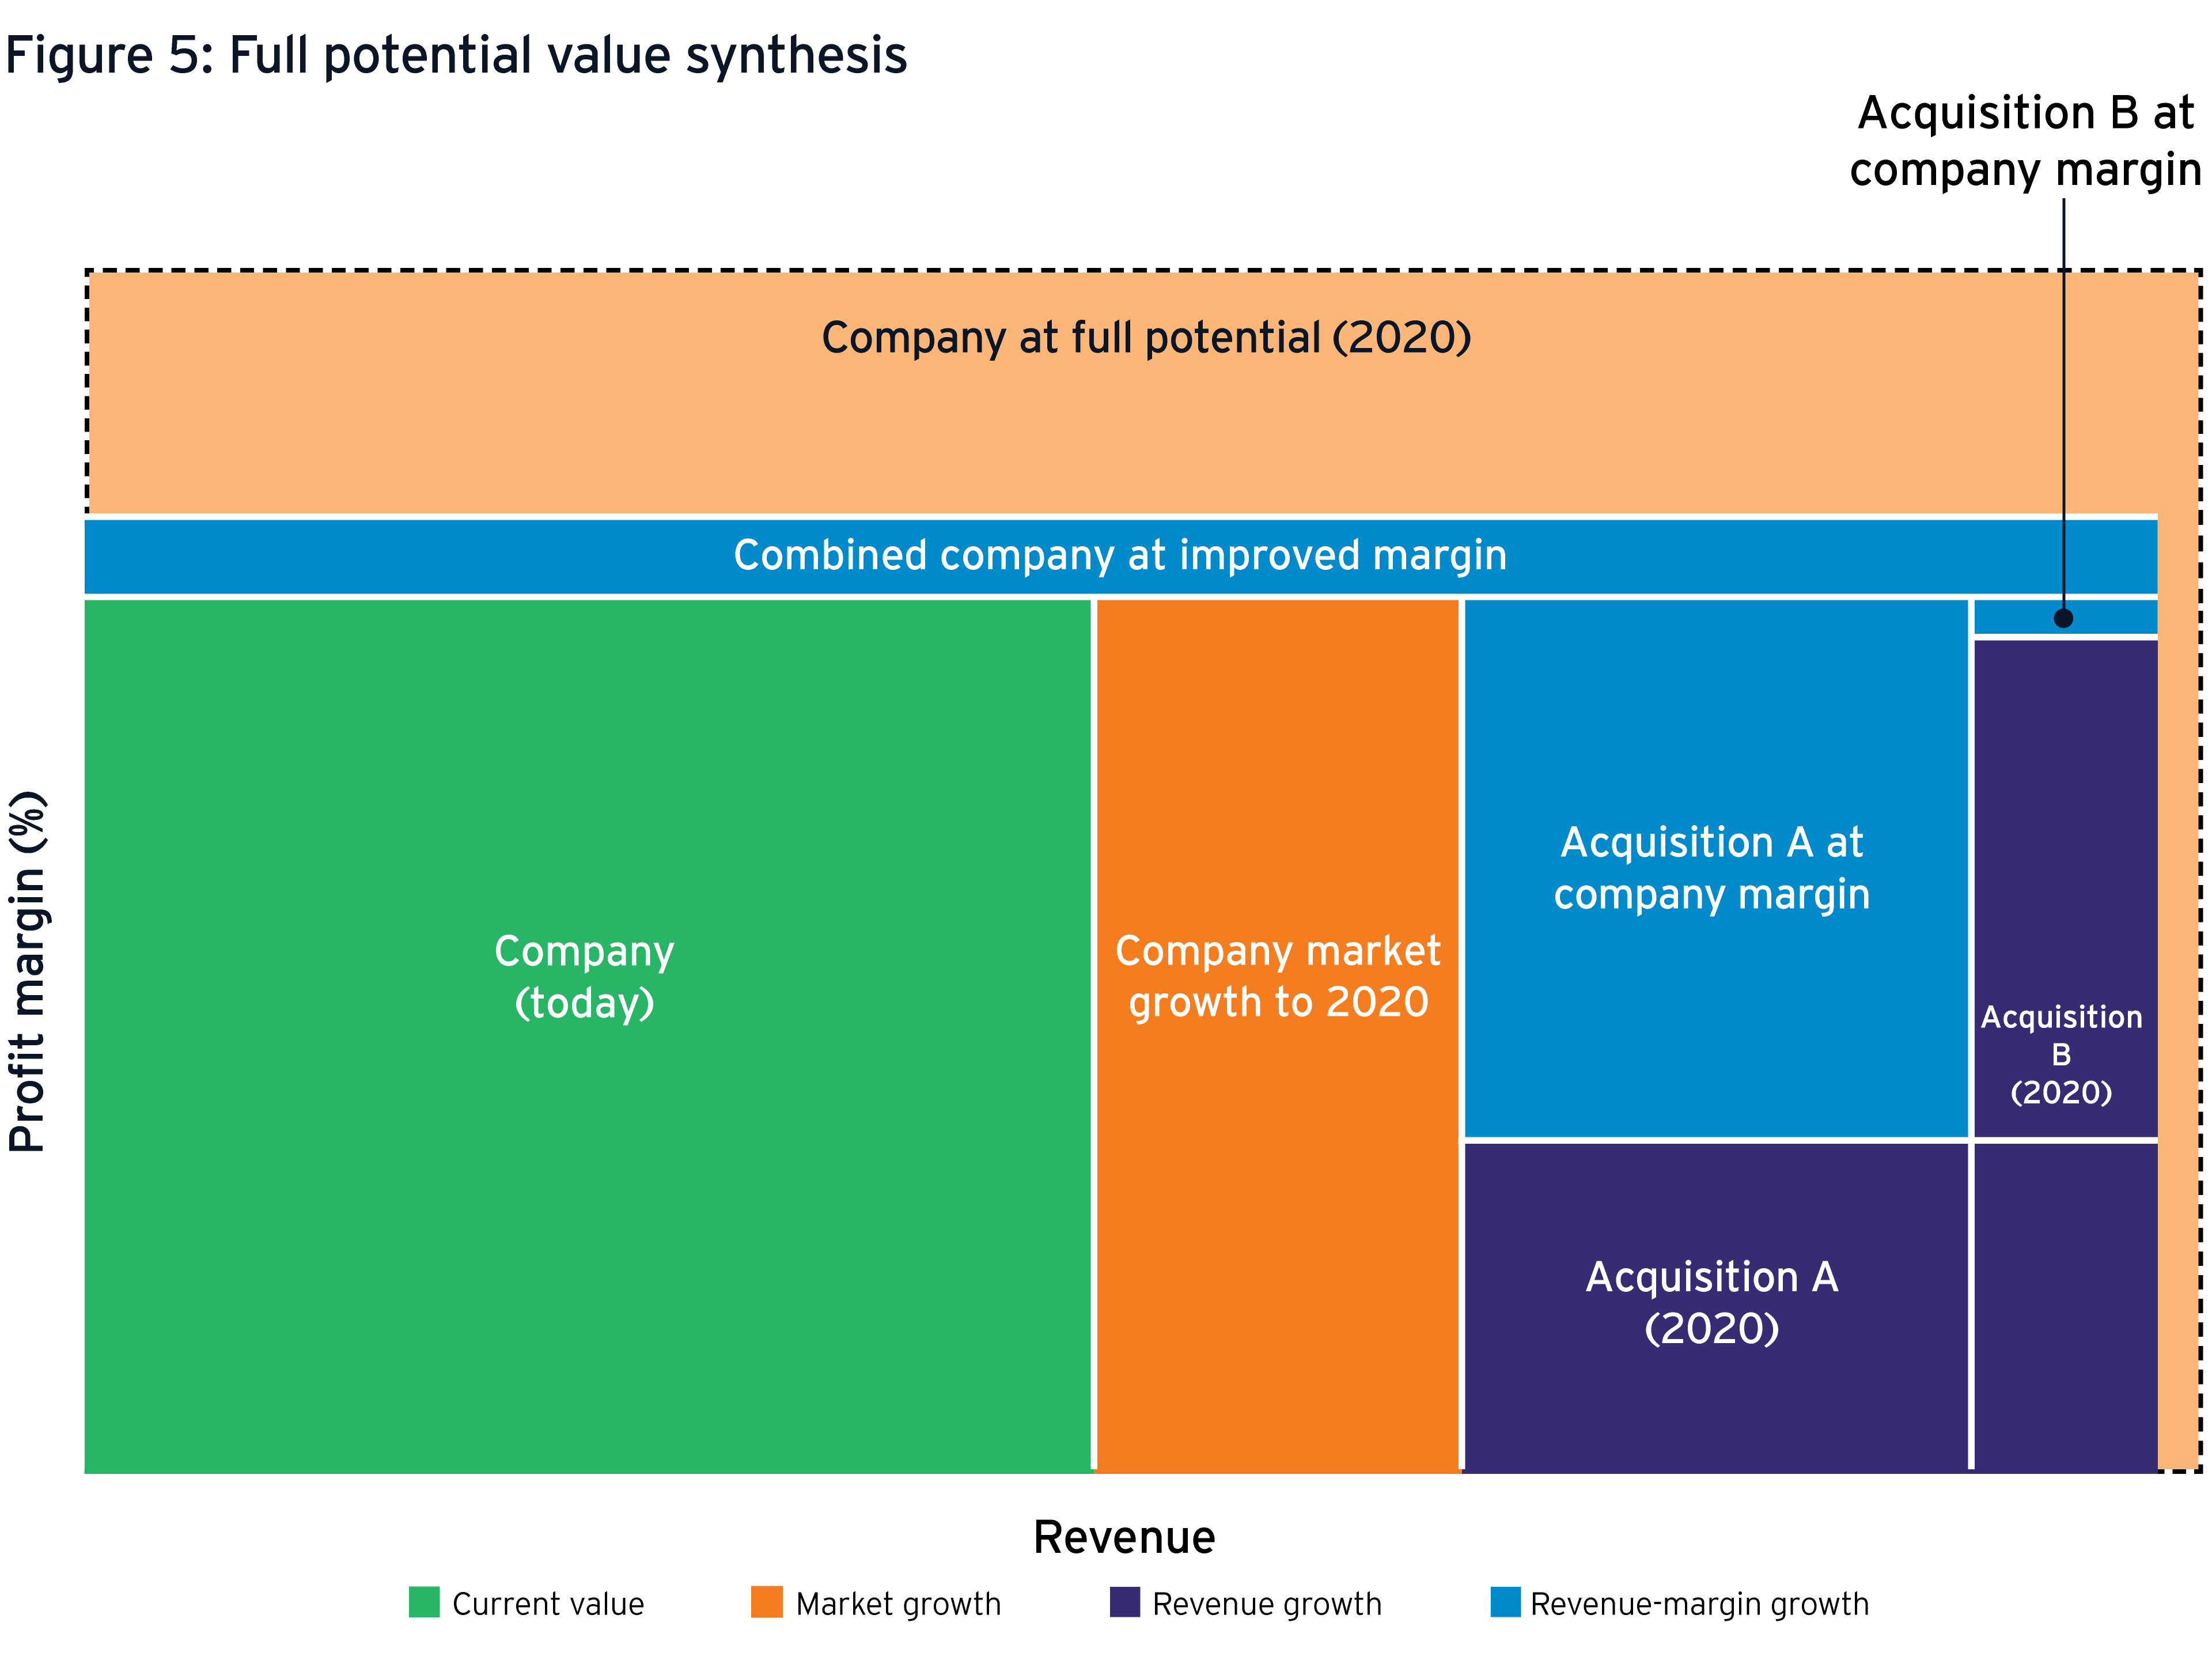
5. Full potential value synthesis
Once the business definition is complete and tested, stretch targets are established, and there is a core understanding of the drivers of market valuation and investor expectations, we start to model various scenarios for achieving full potential. These strategic options might include anything from incremental improvements to new market entry and transformative acquisitions and divestments.
Figure 5 presents one scenario that examines the effects of two acquisitions on a company. Starting in the lower left and reading the chart from left to right, we can understand:
- How the company expects to grow on a stand-alone basis through 2020
- The disproportionate effect of acquisition A, which would rely heavily on the acquiring company to improve margins, vs. acquisition B, where margins would not be an issue
Then reading the chart, we see the remaining margin improvement necessary to reach the combined company’s full potential value by achieving the 80th percentile in its Normative Band.
By pulling together all four FPP components and visually comparing alternatives, management can explore different combinations of organic initiatives and the sequencing of possible acquisitions and divestments.
In this brief tour of the FPP diagnostic, we’ve seen how detailed and focused analytics help support strategic choices about which markets to invest in and which to exit. FPP helps provide actionable perspectives on capital allocation, portfolio optimization and investor communications.
Adapted with permission from The Stress Test Every Business Needs by Jeffrey R. Greene with Steve Krouskos, Julie Hood, Harsha Basnayake and William Casey. Copyright © 2018 by EYGM Limited. All rights reserved. Published by John Wiley & Sons, Inc.

