5 minute read 27 Aug 2024
Saturn rocket engine exhaust pipes

Q2 2024: How did the Swiss valuation parameters and the European M&A volume develop?

Authors
Hannes Schobinger

Partner, Leader Valuation, Modeling & Economics | EY Switzerland

Passionate about corporate finance.

Marc Filleux

Partner, Strategy and Transactions | EY Switzerland

Seasoned expert for valuation, modeling and economics in a transactional (sell & separate and buy & integrate) context.

5 minute read 27 Aug 2024

Valuation Market Essentials Switzerland - what key highlights did we observe in Q2 2024?

In brief
  • No new company was listed on the Swiss SIX stock exchange. However, there were four delistings on the exchange: two in Media, Technology and Telecommunications (MT&T), one in Industrial goods & services (IG&S), and one in the Healthcare sector.
  • Compared to Q1 2024, the median EBITDA trading multiples declined for the MT&T and Retail and Consumer Products (R&CP) sectors, remained stable for the Chemicals, Construction and Materials (CC&M) sector, and increased for IG&S, Healthcare and Energy and utilities (E&U) sectors.
  • In Q2 2024, the European M&A landscape experienced an uptick, with the total transaction count rising by 13% to 148, up from 131 in the preceding quarter. The average deal volume increased by 71% as compared to Q1 2024. The number of transactions in Q2 2024 lies however 20% below the number of transactions in the same quarter a year ago.
  • During the observed period, the Price-to-Earnings (P/E) ratio for Insurance companies experienced an increase. In contrast, Retail and cantonal banks saw a decrease in this metric, whereas Global and private banks remained stable. Concurrently, the Price-to-Tangible Book (P/TB) ratio exhibited an upward trend for Global and private banks as well as Insurance companies, while it remained stable for Retail and cantonal banks when compared to the preceding quarter.
  • Compared to the previous quarter, the spot rates of 10-year government bonds for the USD and EUR experienced a slight uptick, reaching 4.4% (up from 4.2%) and 2.5% (up from 2.4%), respectively, in Q2 2024, while the rate for the CHF decreased slightly to 0.6% (down from 0.7%).

In times of economic turbulences, we deem monitoring the development of the most recent market data to be crucial to understand its impact on the key parameters used in corporate valuations. In our quarterly publication Valuation – Market Essentials Switzerland, we present the key highlights of the most recent market developments. The publication covers market multiples and cost of capital components per sector for the companies of the Swiss All Share Index (except general financial and real estate companies) as well as relevant macro-economic data used in business valuations.

Valuation Market Essential Newsletter

Stay tuned and sign up to our EY Valuation Market Essentials Newsletter. 

Subscribe

PDF Brochures

Get more insights in our brochures. 

 Download Q2 2024 brochure here

Download historical brochures here


Dynamic Dashboard

Visit our dynamic Dashboard for an interactive deep dive into the market data.

View the dashboard

Sector abbreviations:

R&CP – Retail and consumer products

E&U – Energy and utilities

IG&S – Industrial goods and services

MT&T – Media, technology and telecommunication

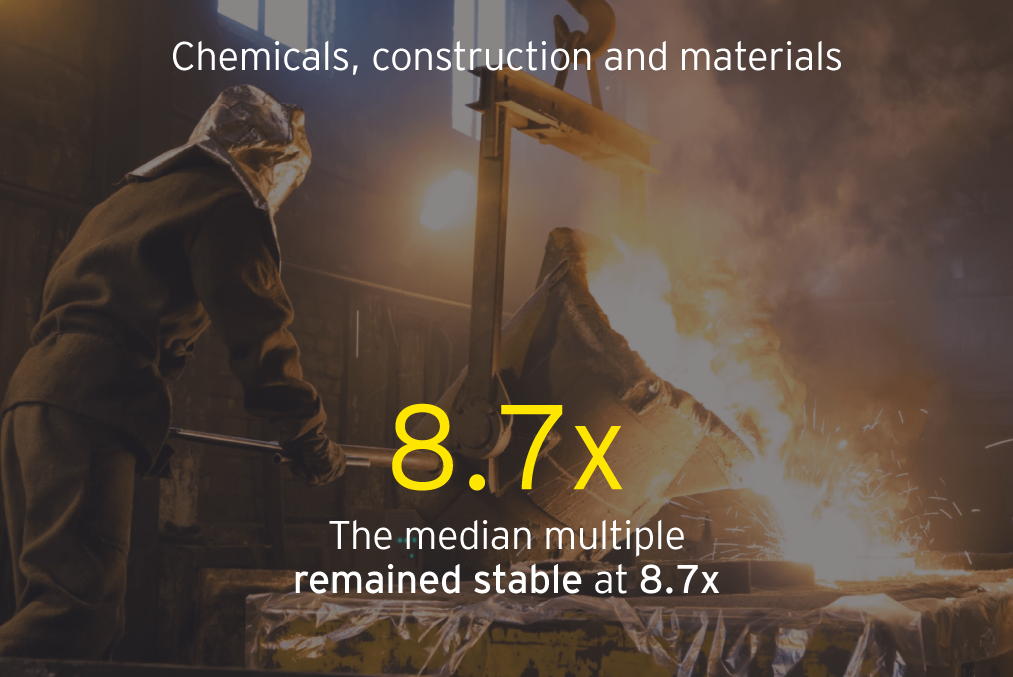
CC&M – Chemicals, construction and materials

  • Trading multiples Switzerland

    In Q2 2024, the median trading EBITDA multiples of the six sectors showed the following development:
    Given that for Q2 2024 and Q1 2024 the EBITDA figures for most companies across all sectors are based on the same financials as of December 2023 (80% of the companies) and as of March 2024 (16% of the companies), the development of the multiples is mainly driven by the development of the market capitalization of the major part of the underlying companies. To gain further insight into the development of the trading EBITDA and EBIT multiples per sector and subsector over the last 5 quarters, explore our Dynamic Dashboard by clicking the link given above.
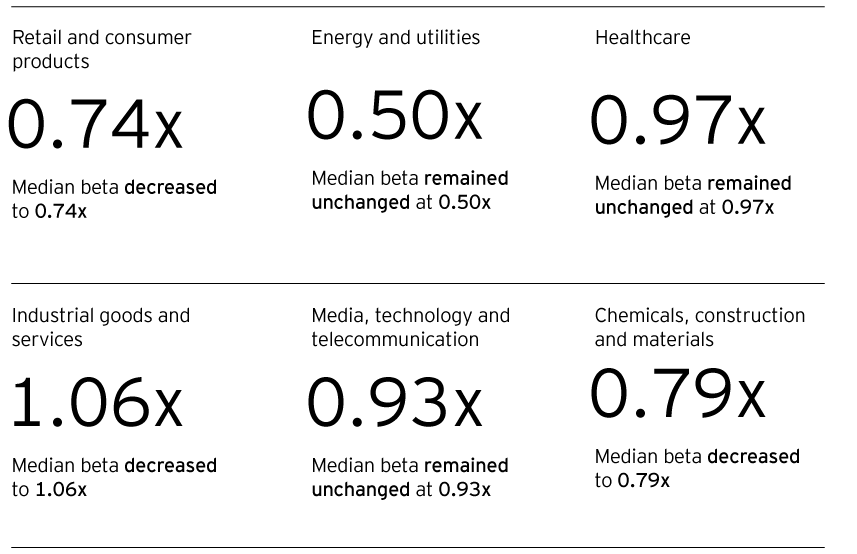
  • Transactions Europe

    Total number of transactions in Q2 2024 vs. Q1 2024

    148

    The European M&A activity increased by 13%, rising from 131 to 148 transactions in Q2 2024 when compared to the preceding period.

    Total number of transactions in Q2 2024 vs. Q2 2023

    -20%

    Compared to the same quarter last year, the number of transactions declined by 20%.

    *The total number of transactions refers to M&A transactions which were announced or announced and closed, and where at least one of the Revenue, EBITDA or EBIT multiples, have been published.

    The overall increase in the number of transactions with respect to Q1 2024 was driven by three sectors.
    R&CP: The M&A activity decreased to 24 transactions
    E&U: The M&A activity increased to 10 transactions
    Healthcare: The M&A activity remained unchanged at 14 transactions
    IG&S: The M&A activity increased to 45 transactions
    MT&T: The M&A activity increased to 43 transactions
    CC&M: The M&A activity remained unchanged at 12 transactions

    Average transaction volume in Q2 2024

    USD 791.4m

    The average transaction volume (total transactions value/number of transactions) increased to USD 791.4m in Q2 2024 driven by all sectors except R&CP, CC&M and Healthcare.

    Top Country

    UK

    Over the past two years, the UK has maintained its position as the leading country in terms of the number of transactions and the location of the target company. In Q2 2024, the UK accounted for 22% of the total transactions, followed by Italy (11%) and Norway (10%).

  • Unlevered beta

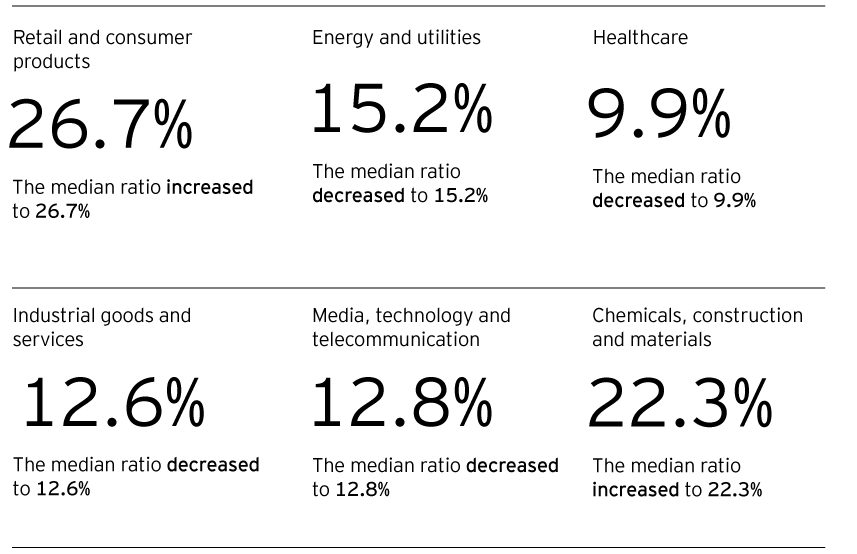
  • Debt to total capital ratio

    For Q2 2024 and Q1 2024, the EBITDA figures for most companies across all sectors are based on financials as of December 2023 (80% of the companies), and as of March 2024 (16% of the companies). The change in the debt-to-total capital ratio is primarily driven by the development of the market capitalization of these companies. Since Q1 2024, the median debt-to-total-capital ratio has decreased for all sectors, with the exception of R&CP and CC&M.
    To drill down through the debt to total capital ratios on a sector-by-sector basis during the last 5 quarters, visit our Dynamic Dashboard by clicking on the link given above.
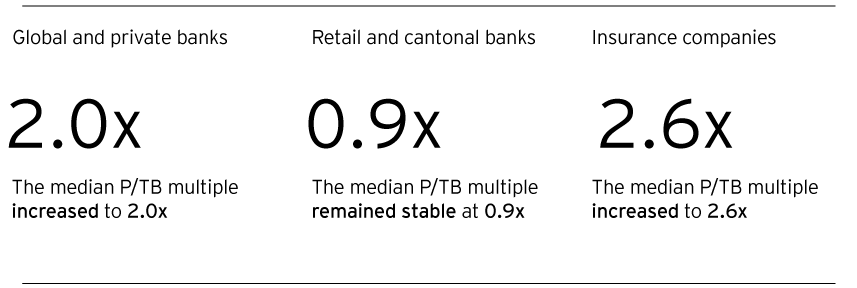
  • Banking and Insurance Sector

    P/TB multiple

Summary

Our Valuation, Modeling & Economics Team is here to support you with valuations, liquidity & scenario planning, portfolio analysis, as well as other services to help you navigate through your action plans.

Acknowledgements

We thank Michael Keck, Alex Benhauresch, Jeremy Guttmann, Elizaveta Tarafa and Deepak Soni for their valuable contributions to this article.

About this article

Authors
Hannes Schobinger

Partner, Leader Valuation, Modeling & Economics | EY Switzerland

Passionate about corporate finance.

Marc Filleux

Partner, Strategy and Transactions | EY Switzerland

Seasoned expert for valuation, modeling and economics in a transactional (sell & separate and buy & integrate) context.