5 minute read 8 Jan. 2024
Hand of woman assembling pieces of wooden puzzle

How life sciences can make the right deals in a time of change

By Subin Baral

EY Global Life Sciences Deals Leader

Committed to helping life sciences companies create focused business models that outperform. Loves road trips and the outdoors.

Contributors
5 minute read 8 Jan. 2024

Show resources

  • 2024 EY M&A Firepower report (pdf)

Life sciences companies are returning to dealmaking amid cost and revenue pressures – how will they find the right deals to secure value?

In brief

  • In 2023, Big Pharma began to embrace big dealmaking once again, as numerous key products face the loss of patent protection in the next five years.
  • Companies across the life sciences sector should do the right deals now to deliver value into the future.
  • Companies must nurture the partners, deal structures, therapeutic areas and strategies to navigate a time of global business and regulatory upheaval. 

In terms of life sciences mergers and acquisitions (M&A) spending, 2023 has already surpassed 2022: the 2022 total was US$142 billion; 2023 hit US$191 billion by December 10. It’s not the deal volume that has risen – we have recorded 116 deals in 2023 compared to 126 in 2022. It’s the average biopharma acquisition size, which has increased by 77% as the life sciences sector’s biggest players – the Big Pharma multinationals – have begun to dominate industry dealmaking once again. 

  • Open image description#Close image description

    Infographic 1:

    Life sciences M&A by year

    An interactive chart showing yearly Life Sciences M&A trends from 2014 to 2023 by volume and deal value. (biopharma and medtech)

    Years      Volume (#)            Deal value (US$b)

    2014                      157                                      317

    2015                      168                                      231

    2016                      138                                      232

    2017                      119                                      169

    2018                      111                                      167

    2019                      110                                      313

    2020                      95                                        165

    2021                      161                                      223

    2022                      126                                      142

    2023                      118                                      191

    Source: Capital IQ, EY analysis
    • M&A deals above $100m analyzed and categorized basis on announcement date

    *Includes deals up to 10 December, 2023

    Infographic 2:

    Biopharma M&A by quarter

    An interactive chart detailing the biopharma M&A trend by quarter, from Q4 2021 to Q4 2023, by both volume and deal value.

    Quarters

    Volume (#)

    Deal value (US$b)

    4Q '21

    27

    32.9

    1Q '22

    15

    10.2

    2Q '22

    22

    26.1

    3Q '22

    21

    16.6

    4Q '22

    19

    41.8

    1Q '23

    11

    55.0

    2Q '23

    21

    42.4

    3Q '23

    24

    25.5

    4Q '23

    16

    34.0

    Source: Capital IQ, EY analysis
    • M&A deals above $100m analyzed and categorized basis on announcement date

    *Includes deals up to 10 December, 2023

In 2023, 67% of M&A investment coming from big pharma, compared to only 38% in 2022. The medical devices sector has remained relatively quiet in dealmaking terms; these companies continue to confront various headwinds, including slowing top-line growth, high costs, and lack of high-growth potential targets.

Looking ahead: why the 2023 uptick is just the beginning

There is every reason to expect biopharma dealmaking to continue and accelerate. Despite its increased dealmaking activity, the sector retains more than US$1.37 trillion in available capital for M&A.

  • Open image description#Close image description

    An interactive bar chart showing biopharma deal power by year, including a 5% decrease in biopharma Firepower from 2022 to 2023*

    Year       Firepower

    2014       1221

    2015       1137

    2016       939

    2017       1056

    2018       977

    2019       1053

    2020       1030

    2021       1288

    2022       1408

    2023       1370

    Average firepower

    1145

    Source: EY, Cap IQ. *Firepower as of 7 December 2023

Biopharma will undoubtedly release significant stores of this Firepower in 2024 and onwards, because the industry is now reaching the much-anticipated “patent cliff,” where there is a sharp decline in revenues upon the expiration of the patent of one or more leading products. The question for the leading biopharma companies is which assets they must target to close these approaching growth gaps.

The problem for dealmakers is that the volatility in the global operating environment, alongside the US Inflation Reduction Act (IRA) and other regulatory developments, adds a layer of complexity. Given these conditions, how can biopharma companies make the right deals to secure value?

While there is ultimately no one-size-fits-all answer for which deals will deliver the best returns, we can highlight certain strategies which will give companies a better chance of securing value in the future:

  • Build more focused business models:

    The life sciences environment is getting more complex, and no company can excel across all business models. Recognizing this, companies have in recent years begun “divesting to invest”: shedding peripheral businesses and units to focus on their core value offering.

  • Identify the therapeutic areas where you can add value:

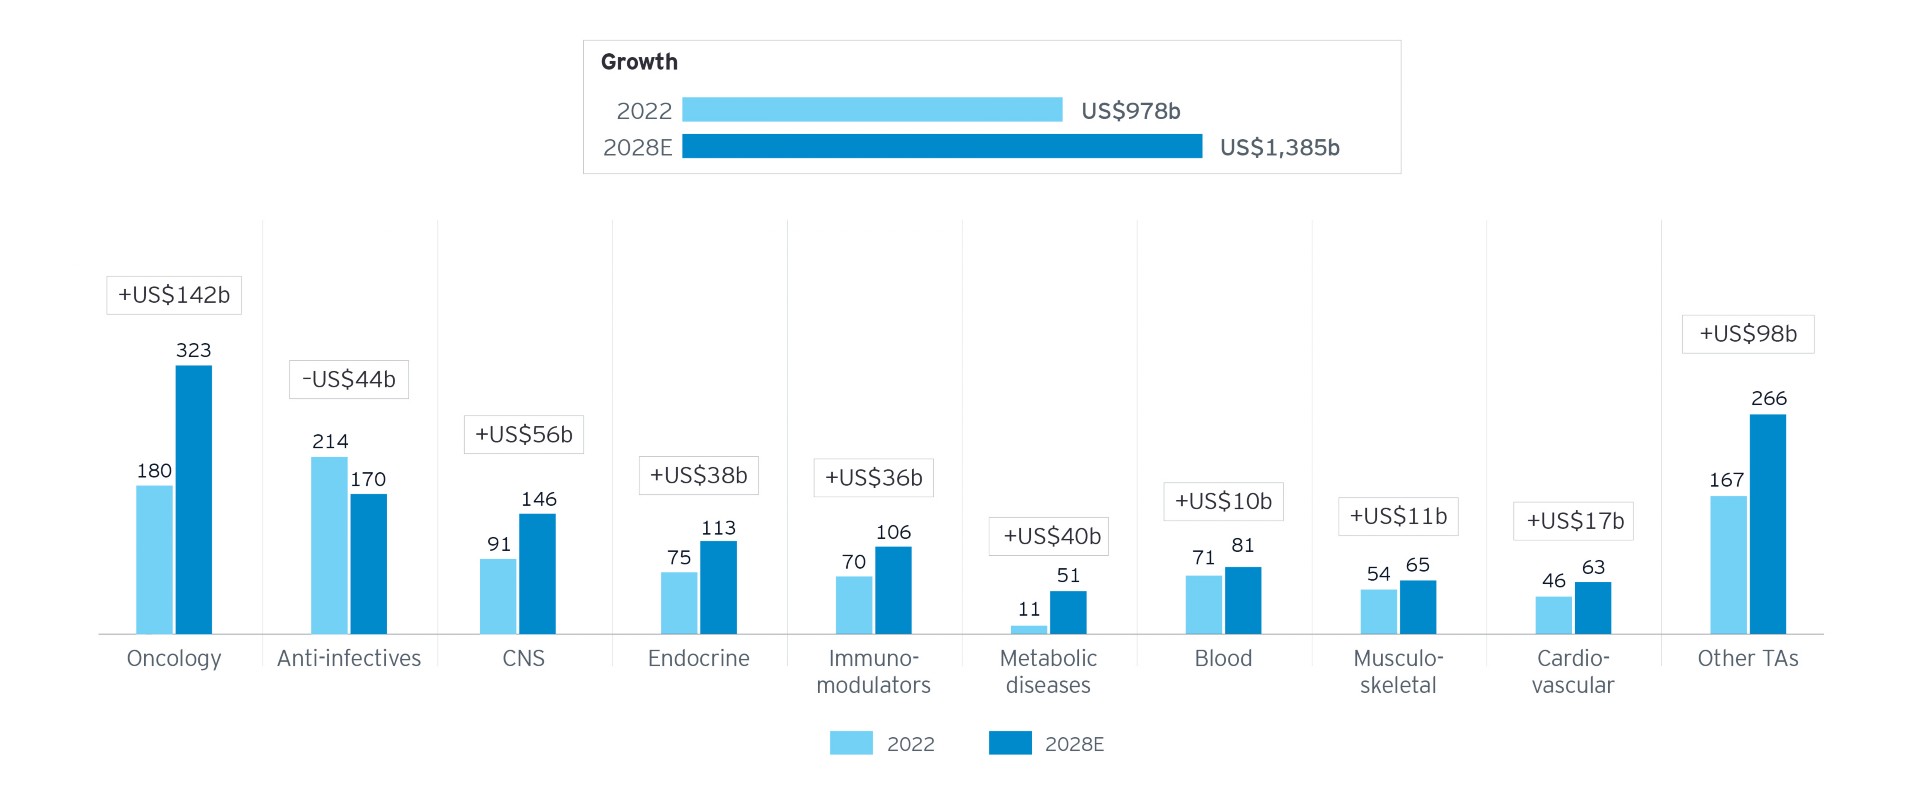
    Companies are increasingly considering the strategic importance of specific therapeutic areas. By 2028, it is estimated that the overall global biopharma market will have grown ~US$419 billion; of this growth, US$142 billion (34%) will come from oncology alone. The huge growth potential of the oncology market is reflected in companies’ M&A spending over the past five years, which has heavily prioritized oncology. The changing regulatory landscape is also focusing attention on rare diseases; with legislation such as the IRA unlikely to affect their price-point orphan drugs have become one of the biggest M&A targets.
Top therapeutic areas (TAs) expected to drive biopharma market growth, 2022-2028E
  • Open image description#Close image description

    This chart shows the expected market growth of top biopharma therapeutic areas from where they were in 2022 to 2028E.

    • Oncology: 2022 growth was US$180b; 2028E growth is US$323b (+US$142b)
    • Anti-infectives: 2022 growth was US$214b; 2028E growth is US$170b (-US$44b)
    • CNS: 2022 growth was US$91b; 2028E is US$146b (+US$56b)
    • Endocrine: 2022 growth was US$75b; 2028E growth is US$113b (+US$38b)
    • Immuno-modulators: 2022 growth was US$70b; 2028E growth is US$106b (+US$36b)
    • Metabolic diseases: 2022 growth was US$11b; 2028E growth is US$51b (+US$40b)
    • Blood: 2022 growth was US$71b; 2028E growth is US$81b (+US$10b)
    • Musculo-skeletal: 2022 growth was US$54b; 2028E growth is US$65b (+US$11b)
    • Cardio-vascular: 2022 growth was US$46b; 2028E growth is US$63b (+US$17b)
    • Other TAs: 2022 growth was US$167b; 2028E growth is US$266b (+US$98b)
  • Be aware of emerging disruptive new opportunities:

    Companies also need to maintain awareness of game-changing innovations that can disrupt the market. GLP-1 receptor agonists have become one of the most prominent of these recent breakthroughs since trial data has increasingly validated the effectiveness of these drugs to control obesity and improve cardiovascular and metabolic health. The high prevalence and unmet need means that the endocrine and metabolic therapeutic areas are forecast to grow US$78 billion in the next five years; the size of this opportunity could see pharma companies rethinking their strategies and directing Firepower towards the space.

  • Find the right balance between acquisitions and partnership:

    Alliances and partnerships have become a major part of biopharma companies’ innovation strategies. Companies have often used alliances to investigate innovative clinical technology platforms; cell and gene therapy, antibody-drug conjugates (ADCs), and digital technologies have been among the five highest-value areas for alliance investment since 2020. Once these major opportunities begin to translate into commercial realities, companies will be willing to deploy serious Firepower in their direction. In 2023, the ADC market has clearly reached this tipping point. But while other new modalities are still maturing, companies need a mix of alliances and other investments alongside M&A to ensure they have access to new innovations.

  • Build the right execution strategies to deliver valuer from M&A:

    The challenge of M&A is not only to do the right deals, but to “do the deals right.” To ensure their M&A strategies create value, companies need to get their execution right.

Though every deal brings unique opportunities and challenges, we can identify four ways in which companies can realize, preserve, and enable value through M&A: 

  1. Follow strategy-driven discipline – Successful M&A begins with identifying the target best fits with the acquirer’s growth strategy.
  2. Perform due diligence and synergy estimation – Two key factors often observed in failed M&A transactions are the underestimation of costs and overestimation of synergies.  Careful focus is needed in regulatory, safety and quality standards compliance, as well as potential consolidation in R&D. 
  3. Execute effective M&A integration – It is important for the integration program to promote efficient decision-making and rapid execution. Companies can clearly define how they plan to achieve synergies and how the combined business will be run to enhance value. 
  4. Develop robust M&A processes and roadmaps for the future – Active buyers establish strong foundational capabilities to sustain consistent, repeatable M&A activity, developing playbooks and building teams of highly skilled M&A professionals to execute future transactions.

Looking ahead to 2024, we can confidently predict a major ongoing investment in dealmaking on the part of the life sciences industry. As biopharma and MedTech companies look to navigate a period of ongoing global disruption, investment in external innovation will be a strategic necessity. As our analysis shows, the key challenge will be not only doing the right deals but having the right expertise and execution to extract value from those deals and thus secure future growth.

Summary

Looking ahead, the dealmaking imperative will continue to gain urgency. Companies will need to keep finding the right targets and the right partnering approach to replenish revenues. Concentrating on the crown jewel core assets, building depth in key growth therapeutic areas and identifying assets that can truly unlock value will be key requirements. In every case, signing the deal will only be the start – good dealmaking is an ongoing process, and companies need to find the right partners to make it work.

About this article

By Subin Baral

EY Global Life Sciences Deals Leader

Committed to helping life sciences companies create focused business models that outperform. Loves road trips and the outdoors.

Contributors