5 minute read 27 Jun 2022
India’s inflationary pressures

How far would India’s inflationary pressures upset its growth momentum?

By D. K. Srivastava

EY India Chief Policy Advisor

A noted economist, D.K. Srivastava is an Honorary Professor at Madras School of Economics and Member of the Advisory Council to the 15th Finance Commission.

5 minute read 27 Jun 2022
Related topics Tax COVID-19

Show resources

Current high inflation levels in India may continue at least up to Q3 of FY23.  

In brief

  • India’s inflationary pressures are reflected in all three inter-dependent measures of inflation namely, CPI, WPI and IPD.
  • The RBI is expected to increase the repo rate in the upcoming months.
  • Fiscal policy will have to play a strong growth-supporting role through emphasising infrastructure investment.
  • In FY23, India’s growth is projected at 7.2% or higher contingent upon a strong fiscal stimulus. 

Introduction

India, like many other global economies, is currently experiencing serious inflationary pressures. This is reflected in all the three inter-dependent inflation measures namely consumer price index (CPI), wholesale price index (WPI) and implicit price deflator (IPD). The ongoing inflationary pressures have external roots, emanating from the current geopolitical conflict and extensive supply constraints leading to sustained upward pressure on prices of global crude, food and other primary commodities. These trends have transmitted into many administered or semi-administered prices in India including prices of petroleum products and electricity tariffs, thereby adding to the cost-push pressure on inflation. 

CPI, WPI and IPD: distinct weight structures

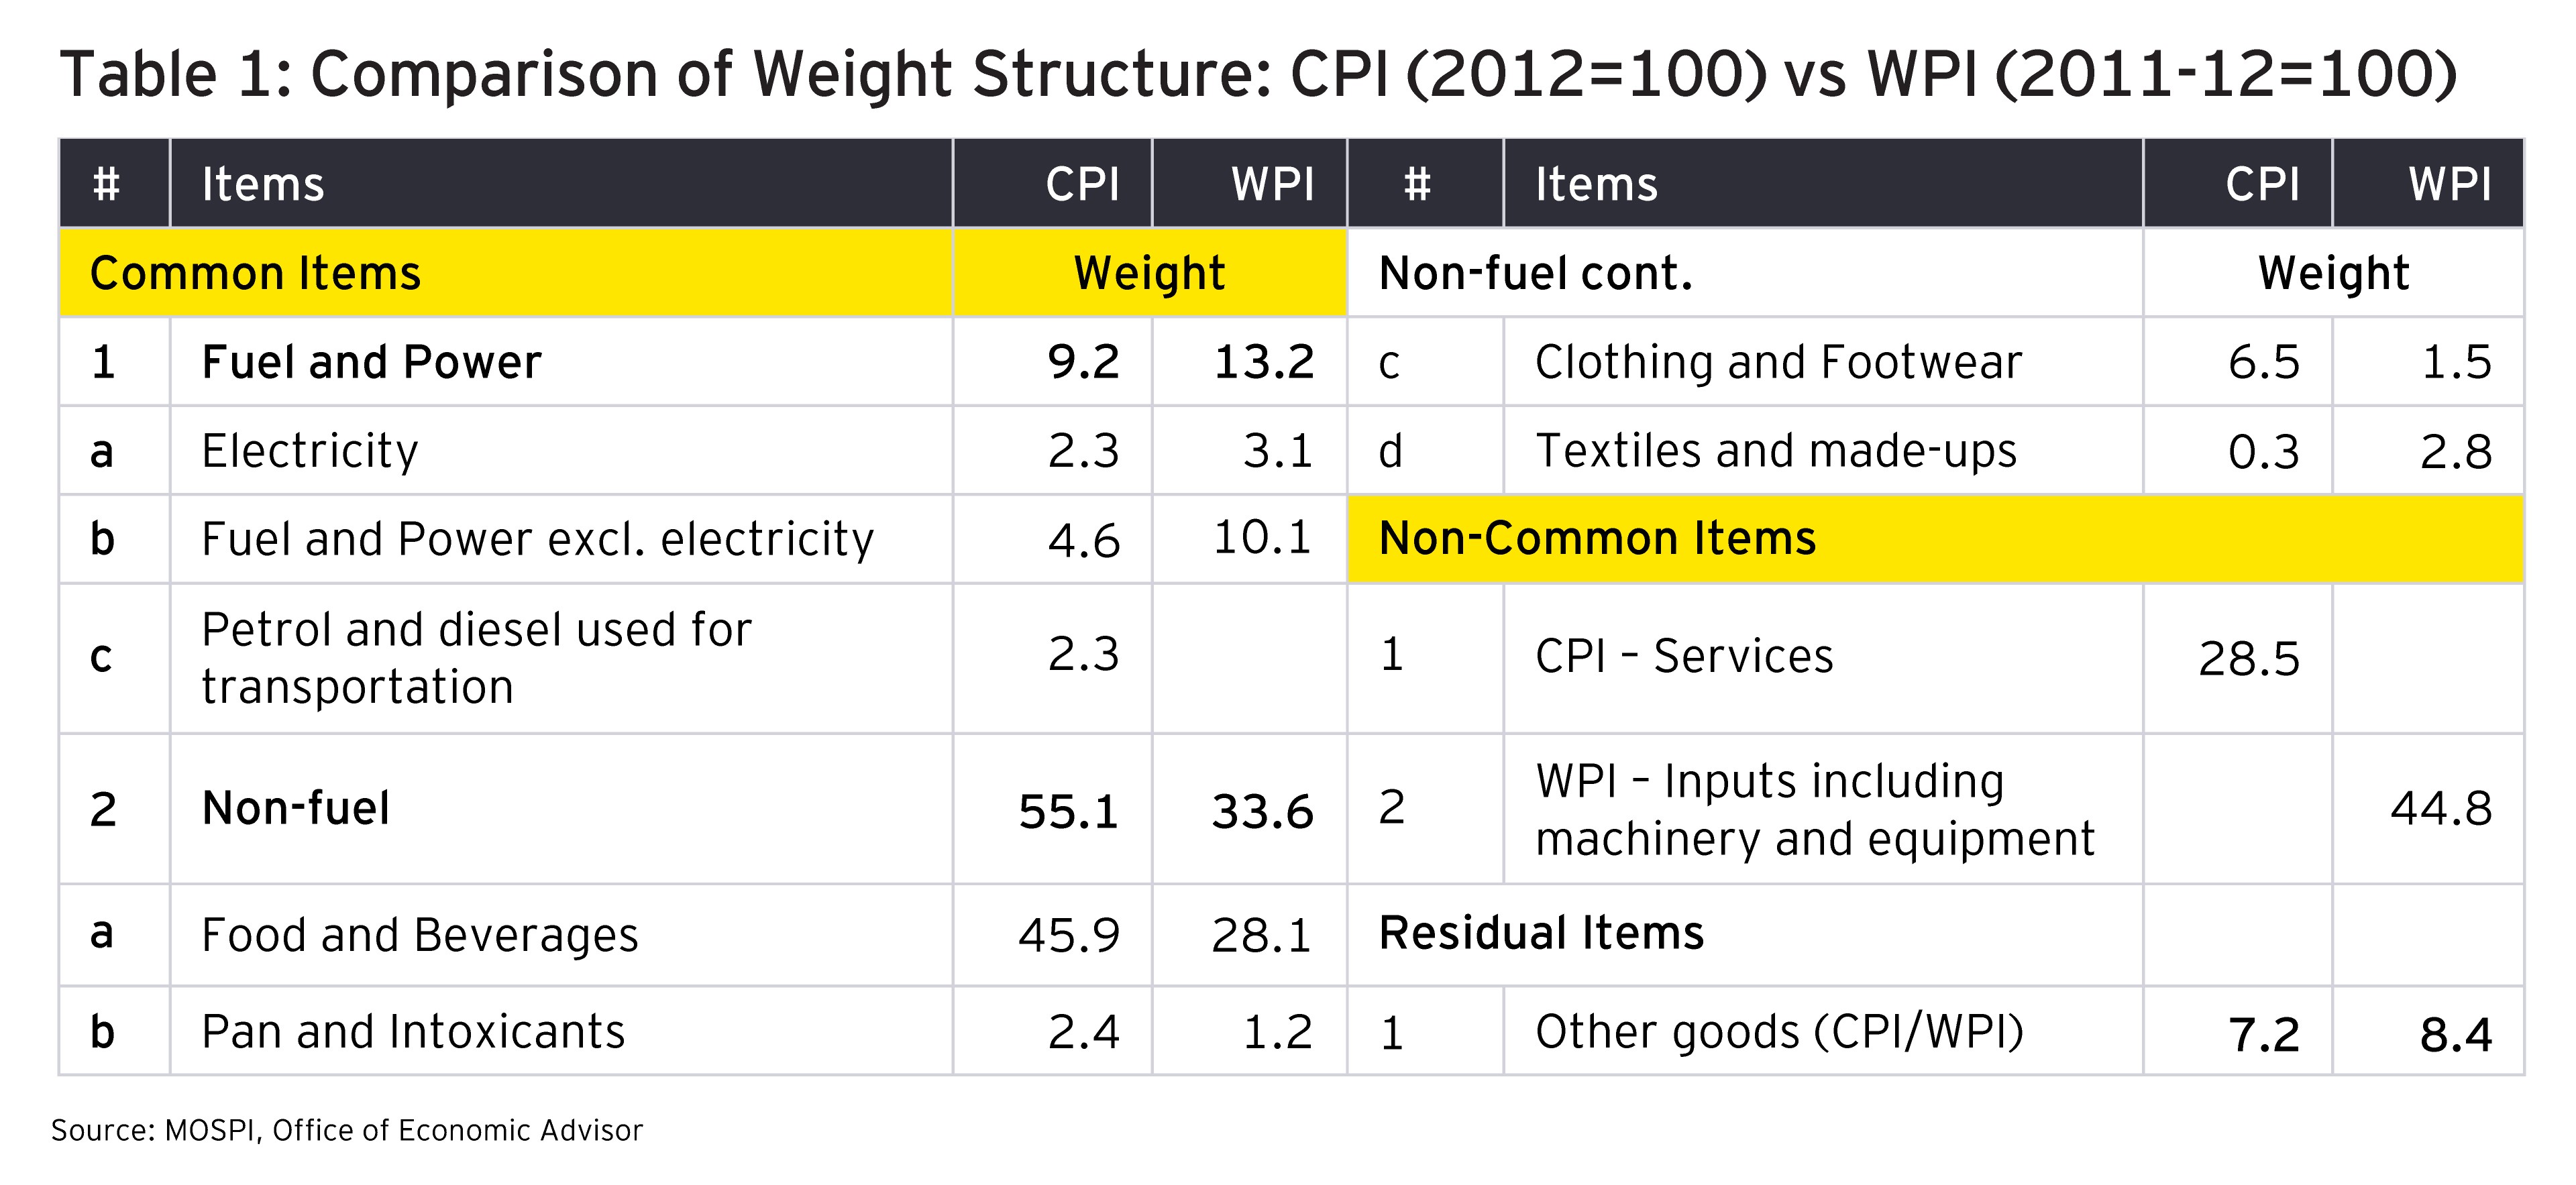
There are three summary measures of inflation in India namely, CPI, WPI and IPD. The coverage and weight structure differs across these measures. Table 1 shows that the fuel and power group has slightly higher weight in the WPI as compared to the CPI. In the non-fuel category, food and beverages have a much higher weight in the CPI as compared to the WPI. A significant portion of the WPI contains items that are excluded in the CPI such as industrial inputs including machinery and equipment, having a weight of nearly 45%. CPI contains services, having a weight of 28.5%, which are not included in the WPI. This was one of the reasons why the CPI was preferred to provide guidance in the formulation of monetary policy.

Comparison of Weight Structure: CPI (2012=100) vs WPI (2011-12=100)

The IPD of national income aggregates pertaining to GDP and GVA where both goods and services are more comprehensively covered, provides a more reasonable guidance regarding the movement of prices. However, IPD is not directly measured, and its data are available only on a quarterly and annual basis. Movements in IPD can be seen as a weighted sum of movements in the WPI and CPI. The relative weights attached to the WPI and CPI inflation in the IPD-based inflation are not explicitly stated. We have derived these through a threshold regression equation. Our results indicate that when the WPI inflation exceeds a certain limit (2.48%), the weight associated with the WPI inflation vis-à-vis the CPI inflation in determining the IPD-based inflation, increases considerably. Prior to this limit, the weight attached to the CPI inflation is higher.1

Recent trends: reaching historical highs

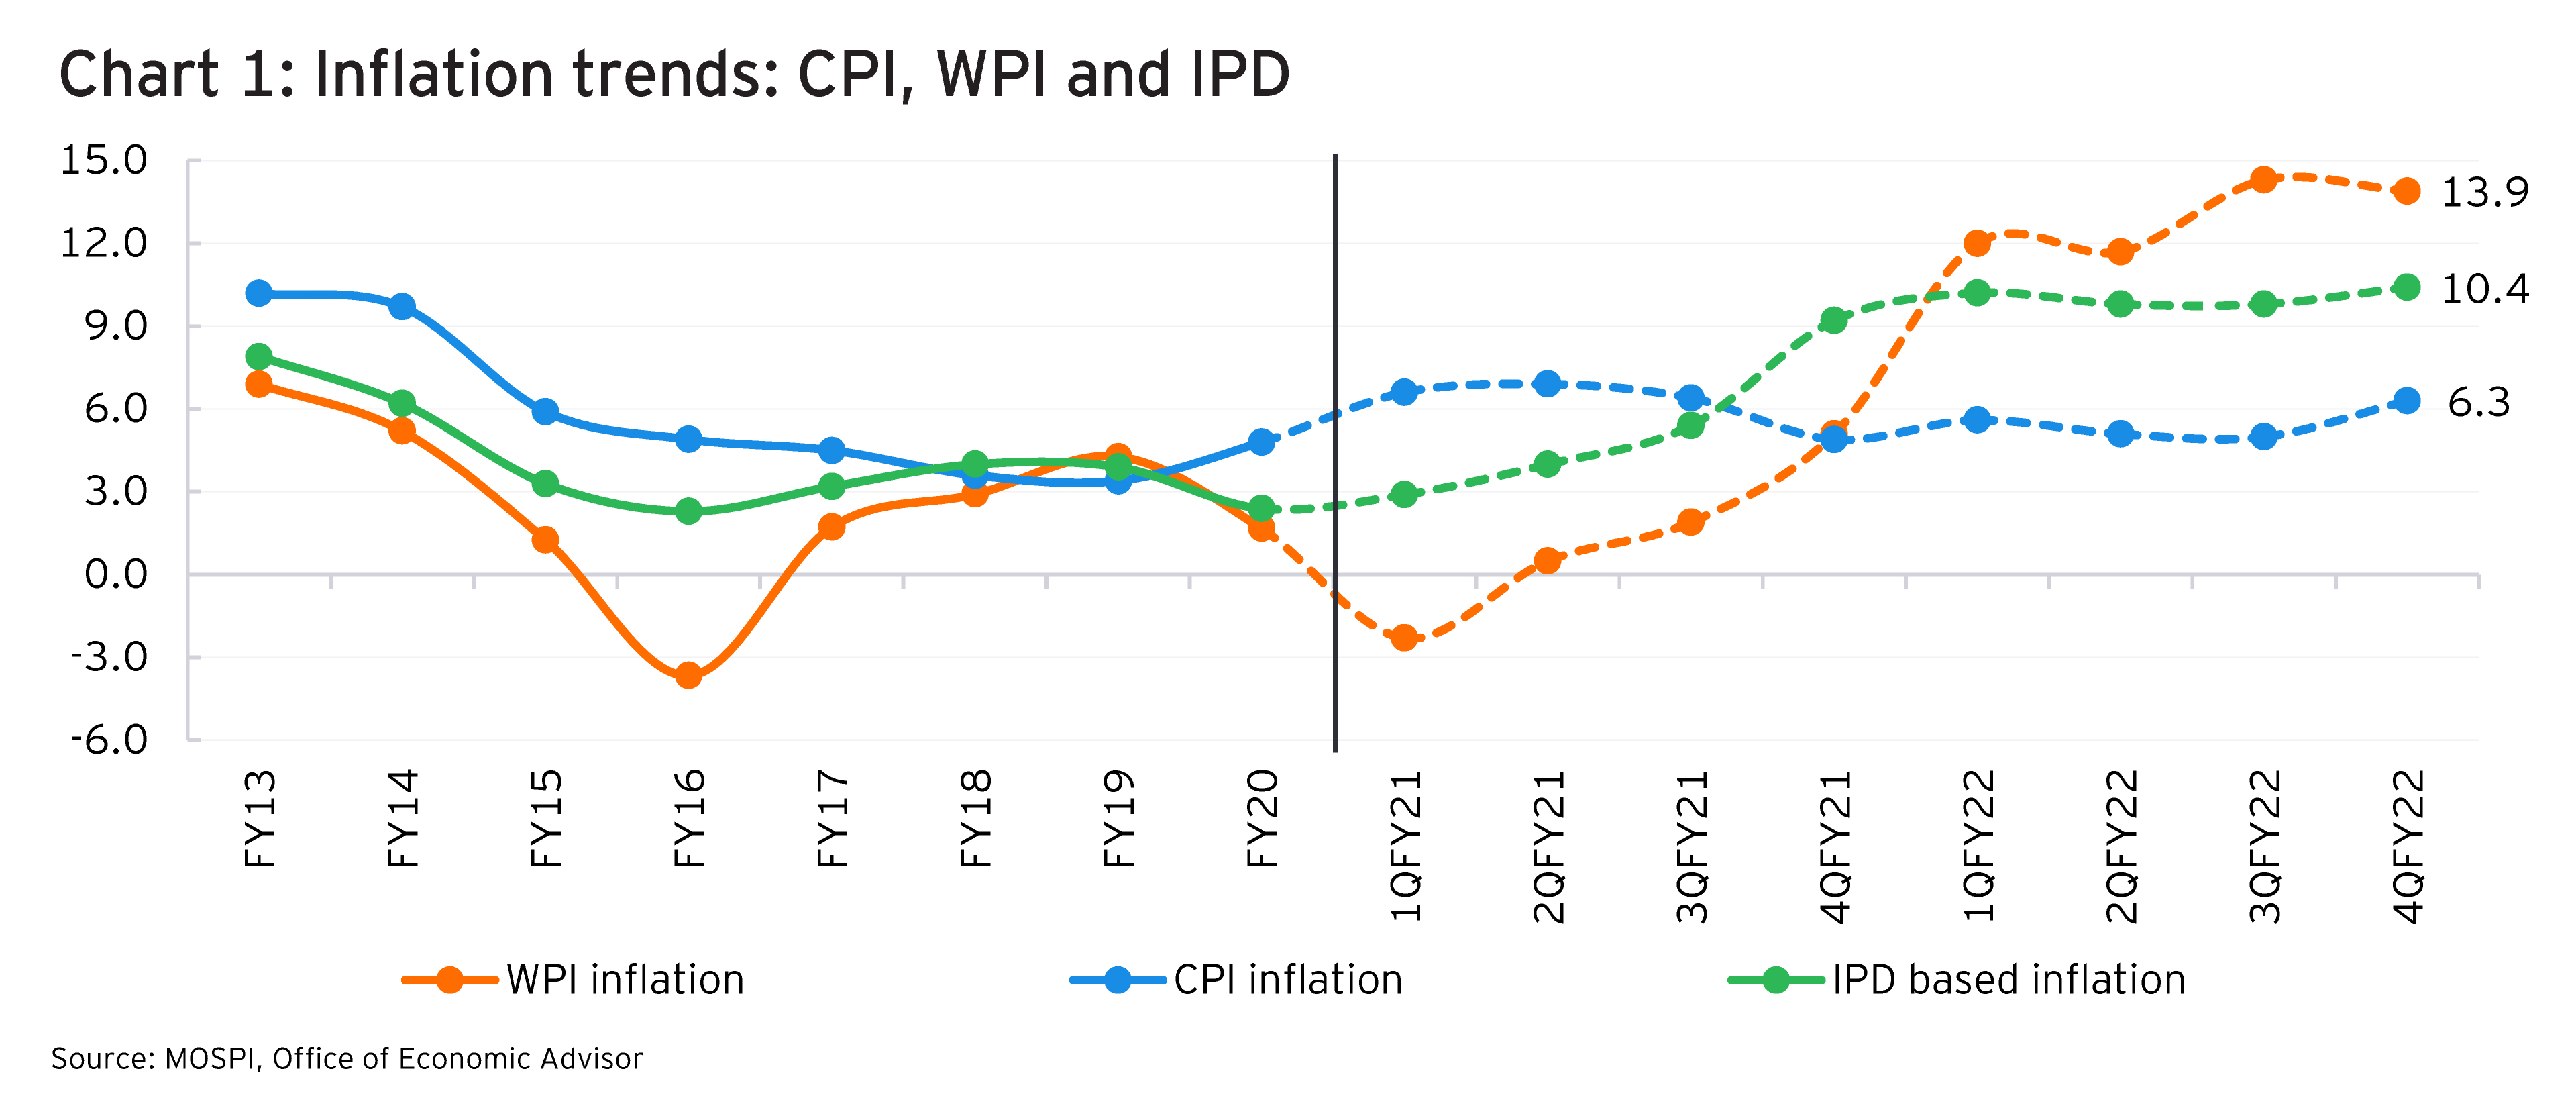
In May 2022, the CPI inflation remained elevated at 7.0%, easing only slightly from 7.8% in April 2022. It is notable that the CPI inflation has remained at or above the RBI’s upper tolerance limit of 6% for five consecutive months. The WPI inflation increased to a historic high of 15.9% in May 2022, signalling continued upward pressure on CPI inflation in the next few months. This inordinately high WPI inflation has been driven mainly by two commodity groups namely, primary articles which includes food items as well as crude, and fuel and power which include electricity and mineral oils. The latest data available for the IPD-based inflation shows that it increased to an unprecedented level of 10.4% in 4QFY22.

A relatively longer history as shown in Chart 1 depicts three notable patterns: (1) significant upward movement of WPI inflation, (2) increase in CPI inflation but with a lag and by a lower margin, and (3) IPD-based inflation tracing these trends, lying in the intermediate space but closer to the WPI line.

Inflation trends: CPI, WPI and IPD

Curbing inflation while supporting growth: active role of fiscal policy

Inflation and growth are two critical inputs in the formulation of both monetary and fiscal policies. In India, the monetary policy framework (MPF) has guided the RBI to remain more focused on controlling inflation while the Ministry of Finance at the Center has been left with the relatively broader responsibility for managing growth while keeping in mind the FRBM norms.

Pushed by sustained inflationary pressures, the RBI, in two consecutive meetings held in May and June 2022, increased the repo rate by 40 and 50 basis points respectively. Together, these have taken the repo rate to 4.9% from 4%, a level at which it was retained from May 2020 to April 2022. Alongside, the RBI also indicated gradual withdrawal of its accommodative stance and revised upwards, its FY23 CPI inflation forecast to 6.7% from 5.7% projected earlier. The RBI changed its base assumption regarding the average price of Indian crude basket in FY23 to US$105/bbl. from US$100/bbl. as assumed in April 2022.

With respect to the FY23 GDP growth, the RBI has retained its forecast at 7.2%, same as in April 2022. The April 2022 forecast was revised down from 7.8% estimated earlier in February 2022. Many multilateral agencies including the World Bank, the IMF and the OECD have also reduced India’s growth prospects for FY23. The lowest amongst these is that by the OECD at 6.9%. Even at this revised lower level, India’s GDP growth prospects for FY23 are tangibly above the global average growth projection and the growth projections for major peer countries.

One positive spinoff of the high inflationary trends is that the IPD-based inflation turned out to be 10.0% in FY22, its highest level since FY11. Correspondingly, nominal GDP growth was at 19.5%. This, combined with a buoyancy of 1.7, yielded a growth of 33.8% in Center’s gross tax revenues (GTR) in FY22, enabling a marginal reduction in Center’s fiscal deficit relative to GDP at 6.7% as compared to the revised estimate of 6.9%.

Going forward, in FY23, the IPD-based inflation may remain high given the current inflationary trends. We estimate that an IPD-based inflation of 10% or more may be feasible implying a nominal GDP growth of about 18%. Combined with a buoyancy of 1.2, Center’s GTR may show a growth of close to 22%, exceeding the budgeted growth of 9.6% for FY23 by a wide margin. Applying this growth of 22% on the actual collections for FY22 as per the CGA, the magnitude of Center’s GTR in FY23 would exceed the corresponding budget estimates by nearly INR5.5 lakh crore, benefitting both the central and state governments. This additional fiscal capacity may be used to bolster both government consumption and investment expenditure after taking into account, inflation-linked increases in expenditures on items such as food and fertilizer subsidies. Some of this additional fiscal capacity may also be used for further reducing excise duty and VAT on petroleum products thereby applying a brake on the inflationary momentum.

Major advanced economies are aggressively increasing their policy rates to contain the inflationary pressures. With CPI inflation in the US reaching a 40-year high of 8.6% in May 2022, the Federal Reserve, in its June 2022 monetary policy meeting, increased the benchmark Federal Funds rate by 75 basis points to a range of 1.5% to 1.75%, its largest rate hike in a single meeting since 1994. The Fed officials expect the year-end Federal Funds rate to rise to 3.4%, up from 1.9% as projected earlier in March 20222. With the sustained uplifting of the US Fed interest rate, there would continue to be an outflow of foreign exchange from India and a reduction in the rate of foreign exchange inflows into India. This may put pressure on the exchange rate which would remain another important cost side pressure on inflation since there would be a continued increase in import cost. India’s balance of payments situation would also deteriorate adversely affecting both inflation and growth. The RBI may have to increase the repo rate in the next few MPC meetings. It is thus the fiscal policy which will have to play a strong growth-supporting role. In FY23, real GDP growth may turn out to be 7.2% or higher contingent upon a strong fiscal stimulus.

Show resources

Summary

The Center may have substantial additional unanticipated fiscal resources in FY23 which may be used for sustaining growth through emphasizing infrastructure investment after accounting for inflation-linked increases in expenditures. Alongside, inflation may be partially contained by further reducing taxation on petroleum products.

About this article

By D. K. Srivastava

EY India Chief Policy Advisor

A noted economist, D.K. Srivastava is an Honorary Professor at Madras School of Economics and Member of the Advisory Council to the 15th Finance Commission.

Related topics Tax COVID-19