How can your growth strategy evolve faster than the market?

Authors
Jim Hsu

Global EY-Parthenon Strategy Leader

Strategy advisor providing insights and clarity into complex challenges. I believe in the power of market forces and data-driven analyses that challenge conventional thinking. Overly proud parent.

Andreas von Buchwaldt

EMEIA EY-Parthenon Strategy Leader

A strategy consultant. Experienced in private equity and technology, media and telecommunications.

9 minute read 4 Dec. 2019

Show resources

  • How can your growth strategy evolve faster than the market? (pdf)

Many companies are setting their strategy against a flawed view of the markets in which they compete.

How sure are CEOs that their current growth strategy will achieve a competitive advantage and sustainable value over the next two to three years?  

In this article, we look at how to understand a company’s true competitive position, how technology is rapidly making current market assumptions outdated and how companies can use market context to drive sustainable growth.

Understanding market context — competitive position is the strongest indicator of potential performance

A market context analysis (such as EY-Parthenon’s Full Potential Paradigm framework) provides a view of the company’s unique position in scale and profitability compared with its competitors, any adjacent segments and new market entrants. Given today’s competitive dynamics, correctly determining market context is difficult. Properly done, though, it largely answers the following critical questions:

  • What are the drivers of growth and profitability for the business and industry?
  • Is the industry concentrated or fragmented? Is it consolidating or stable?
  • Who are the top competitors? Has there been any turnover at the top, and why?
  • Which industry boundaries are under attack?
  • What is your market position vs. the leader and runner-up? What are the main sources of relative market share change for your business? How are these factors changing?

By answering these questions, you can determine from where growth will likely emanate, and which M&A targets should be pursued to deliver long-term value.

Show resources

How to define market context when technology changes everything

Defining market context is part science and part art. It starts with an analysis of how your business is defined, taking into consideration the industry’s dynamics.

It is important not to rely on conventional definitions of your industry, but instead, take a more analytical approach. Utilize the four C’s: customers, costs, capabilities and competition. But analyze them through the lens of innovation and understand the disruptive drivers, such as technology. This not only increases the complexity but will also help develop a more useful view of your company and its competitors.

Three areas of technology innovation affecting the four C’s are: 

  • Information technology — The introduction of mass data collection, storage, analysis and distribution has affected many industries. Today, all players have access to increasingly complex information when assessing the market and their own business. For example, a mobile phone company can use data to segment potential customers and target marketing accordingly.
  • Product technology — Product development has been an area of profound technological improvements. For example, technology has driven the evolution of the insulin pump market, with improvements, such as reduced size, improved battery life and improved effectiveness.
  • Business model technology — These technologies are specific to the value chain of the business. Some examples of business model technology include drone technology and the impact on distribution companies, or 3D printing and its impact on the manufacturing processes.

Understanding how these technologies affect customers, costs, capabilities and competition in your industry makes it possible to better understand your competitive situation. This helps you evaluate what you need to do to gain a competitive advantage that delivers growth.

  • Customers

    “Customers” simply refers to a common set of buyers across an industry and geography purchasing a product or service to solve a similar problem. However, competitive dynamics change customer markets, and new technology is often the catalyst for this change. One example is innovation driving product “premiumization” (i.e., the introduction of new, higher-end products).

    The mobile phone market is a good example of how customer targeting can impact the market context. It may seem like companies in the market share the same customer set: people who want to buy a mobile phone. But while one company may have a larger share of the market, another may be using product innovation to establish itself as a premium brand, commanding higher margins by focusing on a smaller set of customers. 

  • Costs

    Understanding cost structures related to a company’s production, delivery and servicing landscape can help identify your true competitors. This makes it possible to refine your unique business definition. Generally speaking, companies with similar cost structures that meet similar needs of a set of potential buyers are considered competitors. But disruptive business model technologies can radically shift the value chain and, therefore, the cost structure.

    Consider the airline industry — there are notorious pricing and profitability pressures to remain competitive and technology innovation has impacted the industry in many ways on that front. One example is the use of online check-in and self-service baggage check-in kiosks at airports, both lowering operational costs, thereby improving margins and, ultimately, enabling airlines to compete effectively on pricing. Another example showing how technology has impacted the airline industry is the birth of online booking platforms, which have made it easier for customers to compare prices. 

  • Capabilities

    A comprehensive capability analysis makes it possible to identify and evaluate your company’s overall proficiencies. It can also help identify your actual competitors and define relevant adjacencies. There are two types of capabilities to analyze: hard assets — intellectual property, buildings and such — and soft assets — employees and reputation. As with cost, technology disruption in the value chain impacting a company’s or industry’s capabilities can create significant competitive advantage with improvements to either the product or business model efficiency.

    Consider that Samsung used product technology innovation to capitalize on a leadership position in display technologies to transform itself from an electronic parts supplier to a leading provider of televisions and smartphones. This transformation ultimately shifted its perception of competition and, thus, the market context.

  • Competition

    While all of the analysis thus far helps illuminate positioning vs. the competition, it’s important to take a direct look at the market and assess adjacencies and new entrants. You need to look at your competitive market, understand how that market has changed over time and appreciate how it might potentially change in the future. With technology as the fundamental game changer, we see adjacencies and new entrants joining the competitive mix at an accelerated rate.

    The need to scan the market for new products and services at the edges of your industry is essential in identifying future threats to the business. The taxi industry is a great example showing how new technology can affect competition. While the industry still provides point-to-point transportation, the emergence of new entrants, like Uber and Lyft, redefined the business by bringing technological disruption via an app that connects drivers directly to riders.

Using market context to illuminate profitable M&A growth opportunities

Once the market context is set and you have defined your own business and competitive positioning, the next step in the FPP construct is to calculate the relative market share (RMS), one of the best predictors of long-term growth and profit potential. RMS growth drives actual profitability. It is certainly more complex in calculation than standard market share (SMS) because it indexes the end market sales of a company’s competitive set through a geometric mean calculation.1

RMS provides additional insight into the competitive market that SMS lacks. Why is this so important? A growth strategy that is solely focused on increasing revenue is not sustainable. For a properly defined business (based on the market context analysis), profitability is driven by RMS. Companies with high RMS should, with all else being equal, earn more than those with lower RMS. This, in fact, debunks the notion that companies may be “too big to grow.” A high RMS does not limit revenue growth.

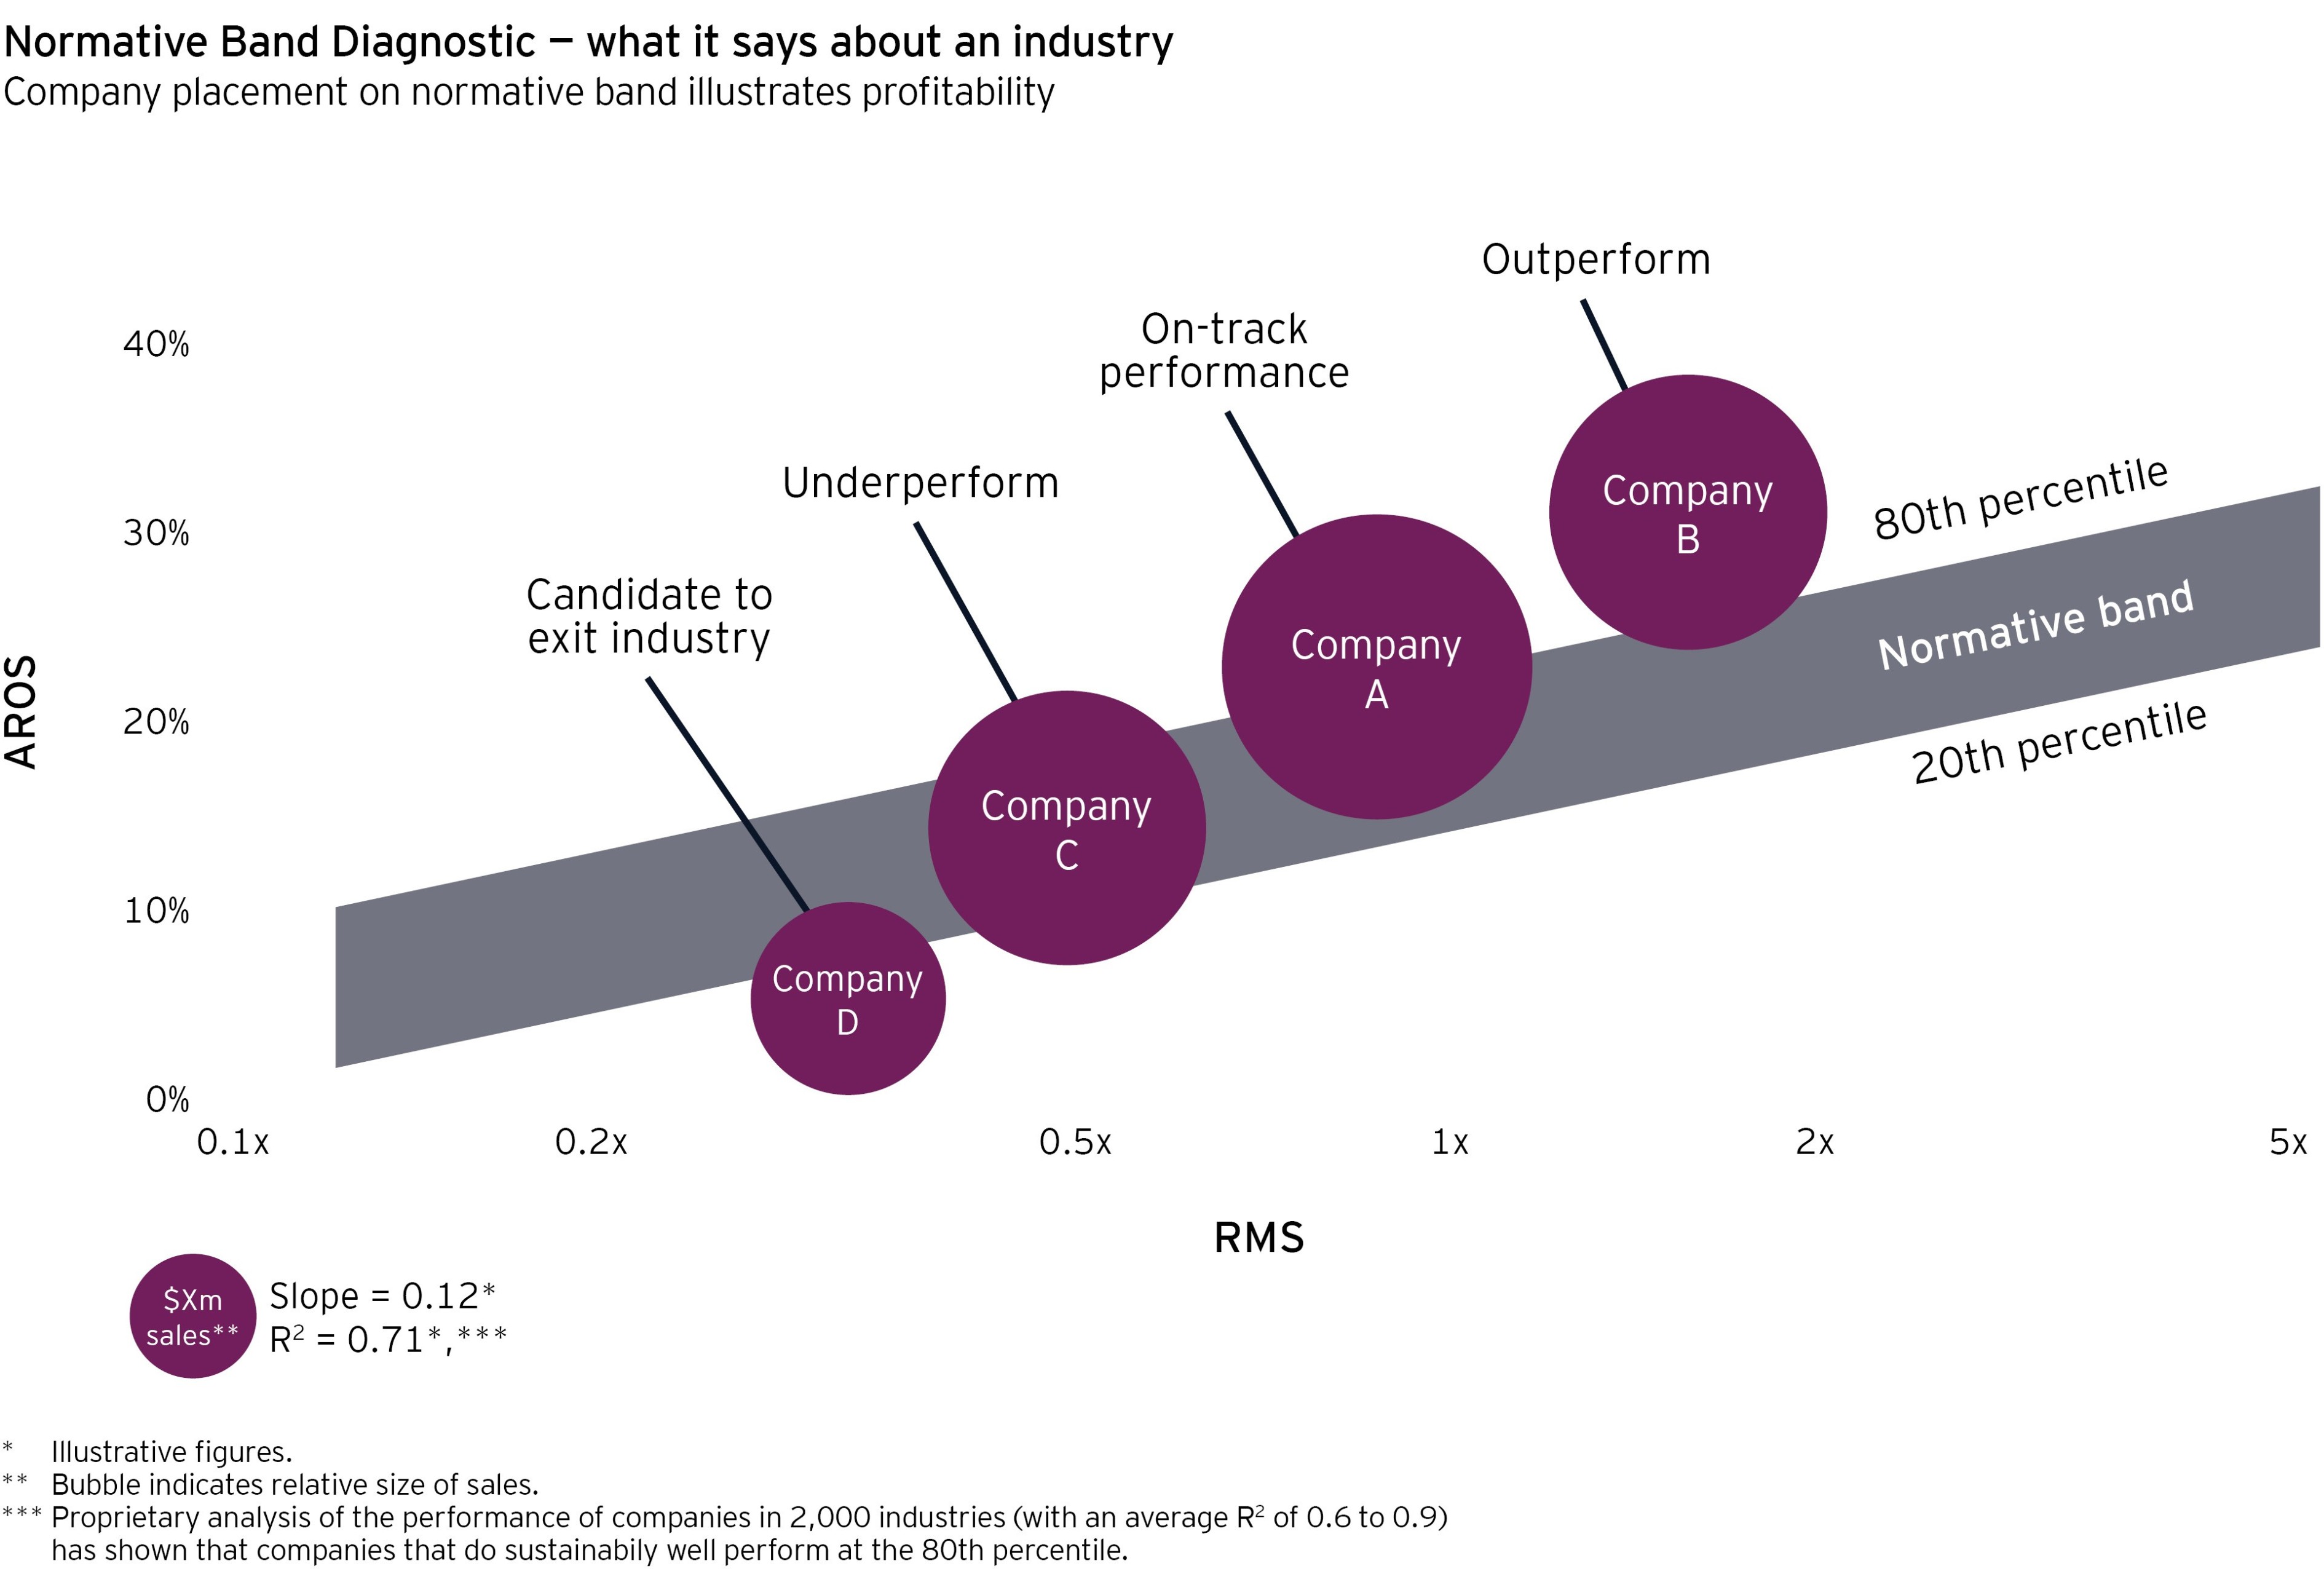
To visualize the power of RMS in setting a growth strategy, a diagnostic from our FPP construct is shown below. Here, we set the RMS against the adjusted return on sales (AROS) to help clients establish growth goals around defined margin targets. In addition, we evaluate specific M&A opportunities to reach these goals.

Normative band diagnostic graph

The Normative Band Diagnostic shows the relationship between which company has the strongest competitive position in the market on the x-axis (the RMS calculation) vs. how they are performing from a profitability perspective on the y-axis (adjusted return on sales - AROS). For each industry, there is a unique normative band sloping up across the chart with a lower band of 20th percentile performance and an upper band of 80th percentile performance.

Using this normative band, companies can determine if profitability is on track (at the 80th percentile, e.g., Company A), outperforming (above the 80th percentile, e.g., Company B), underperforming (below the 80th percentile but above the 20th percentile, e.g., Company C) or a potential candidate to exit the industry (below the 20th percentile, e.g., Company D).

Normative band diagnostic graph 2

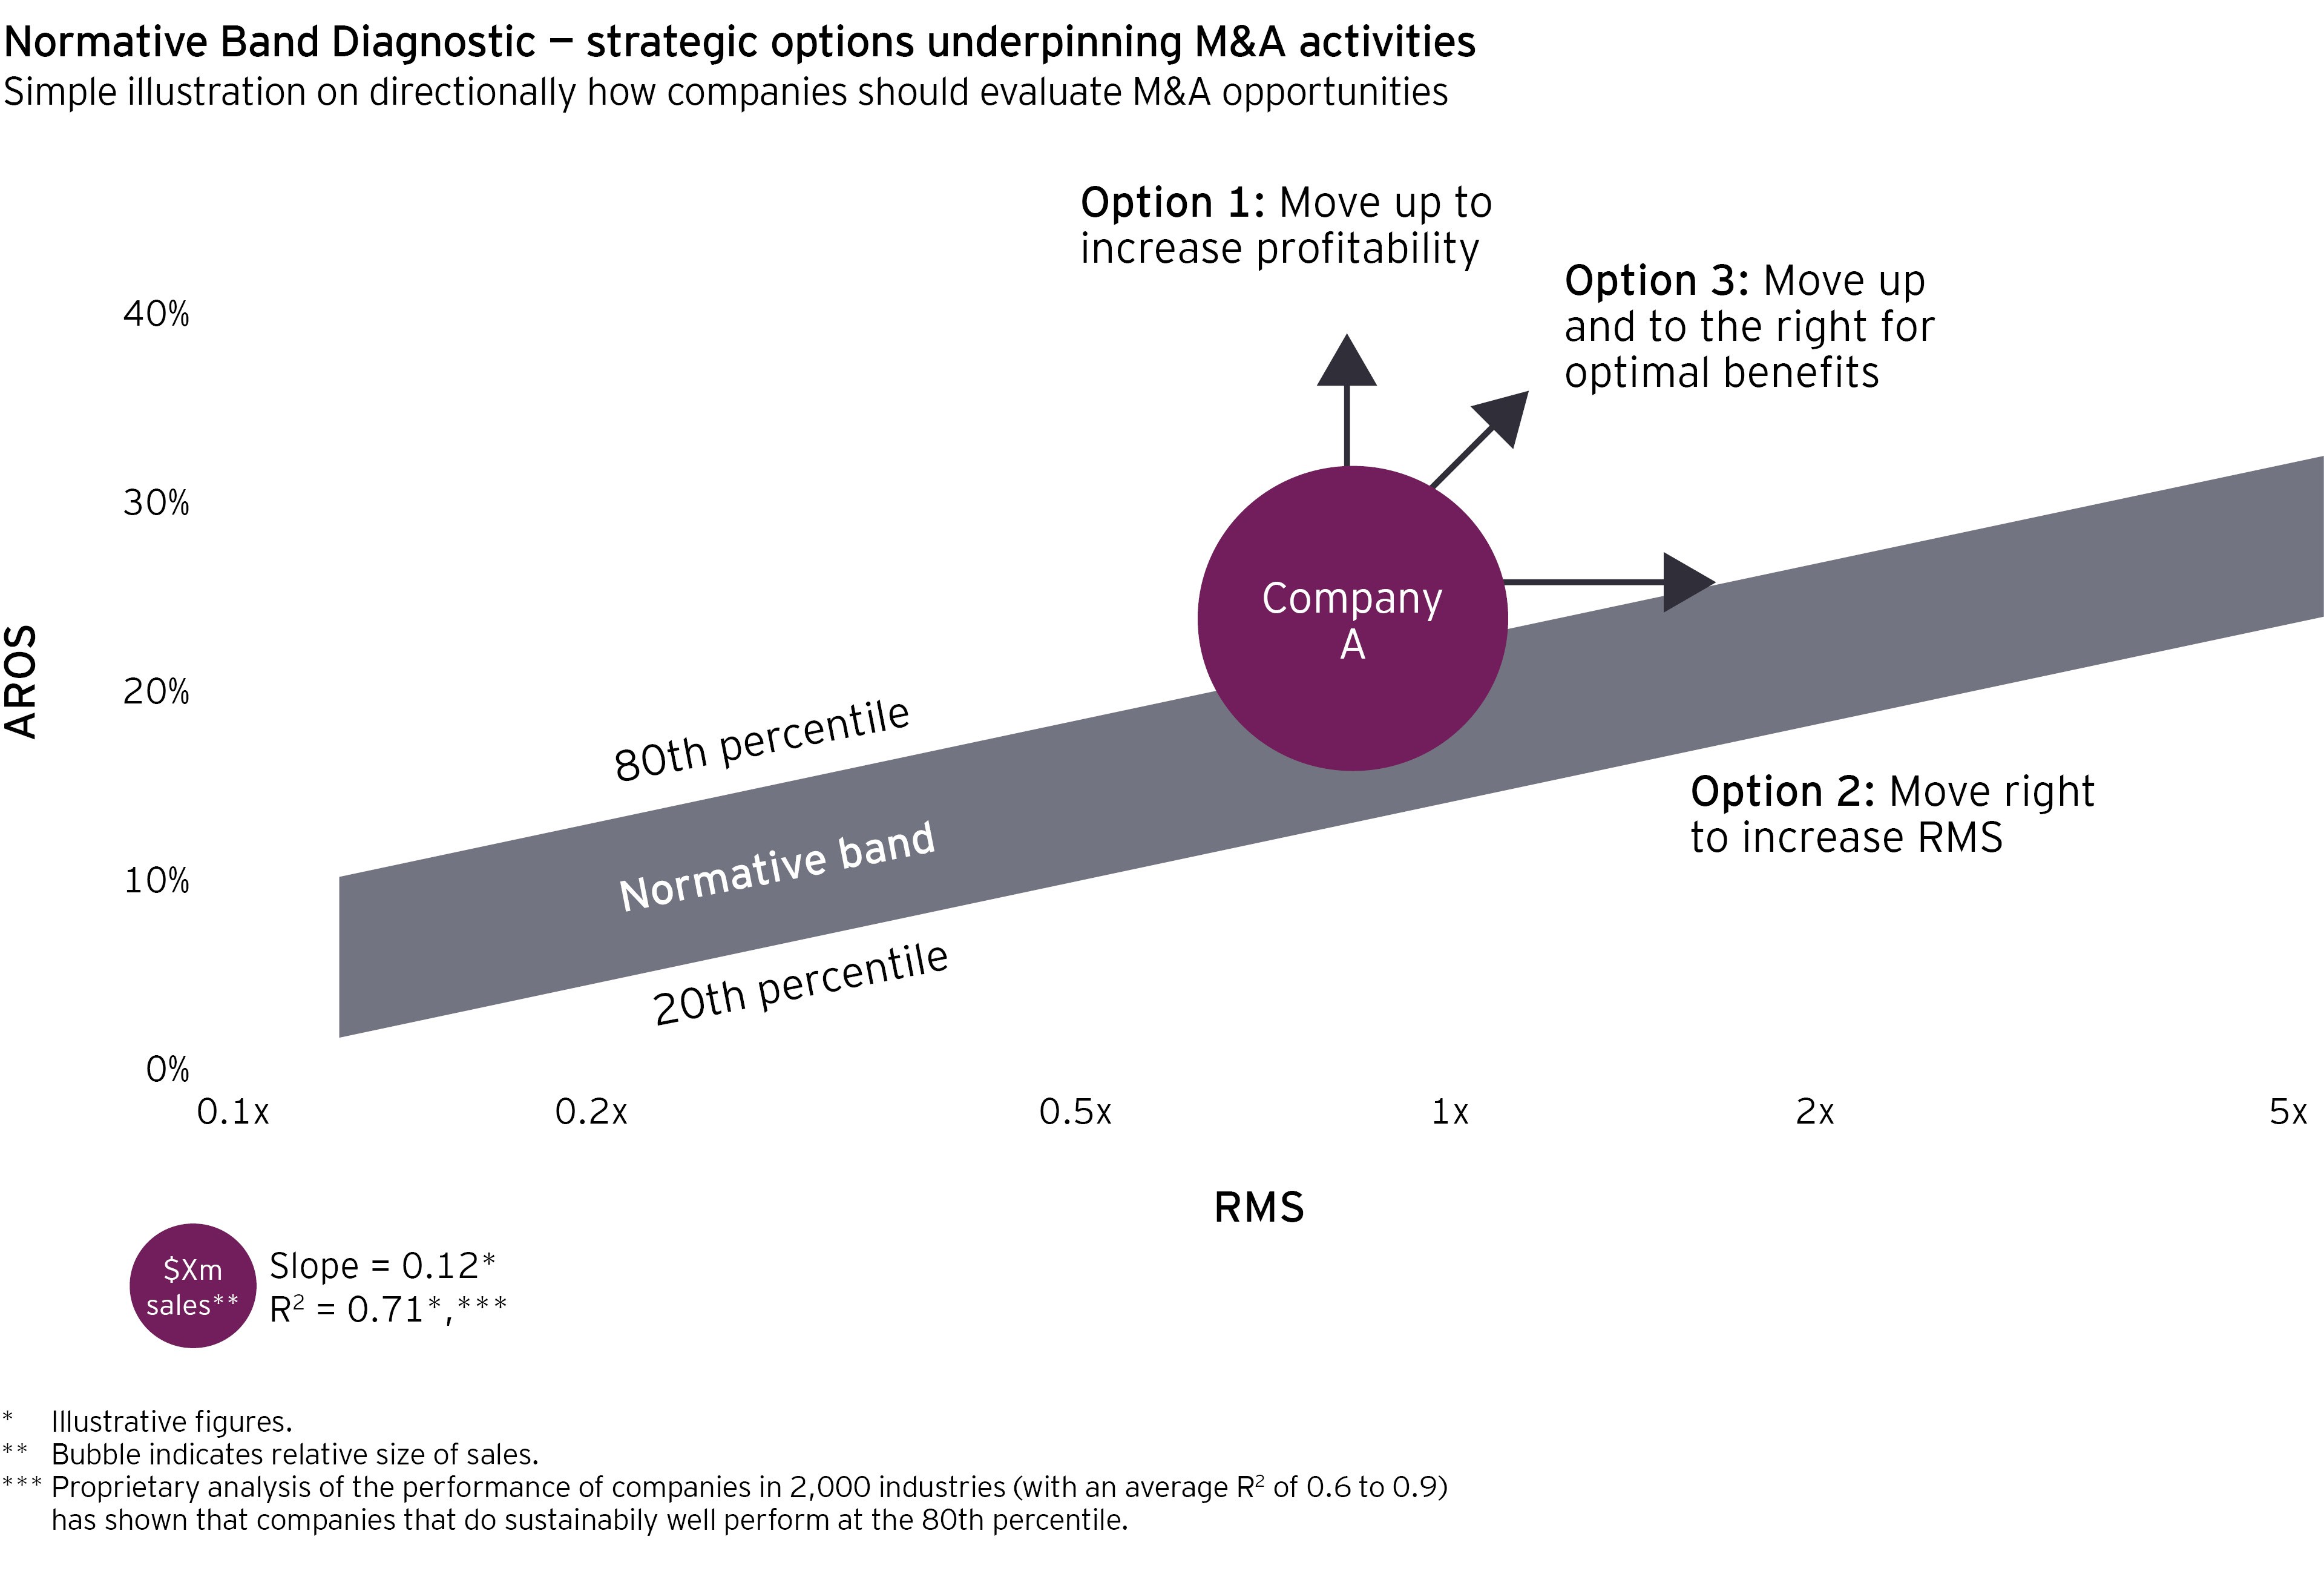
The above chart illustrates the multiple options a company can perceive to improve its market position. Company A can move up and gain more profitability or it can move to the right to achieve a greater relative market share, which should allow a later conversion to higher profitability. Using this type of analysis, a company can evaluate which levers it can pull to affect profitability, including M&A. If M&A is the chosen route, it can then better evaluate to what extent specific M&A opportunities meet the deal rationale needed to drive a company’s competitive advantage and deliver profitable growth and long-term value.

Normative band diagnostic graph 3

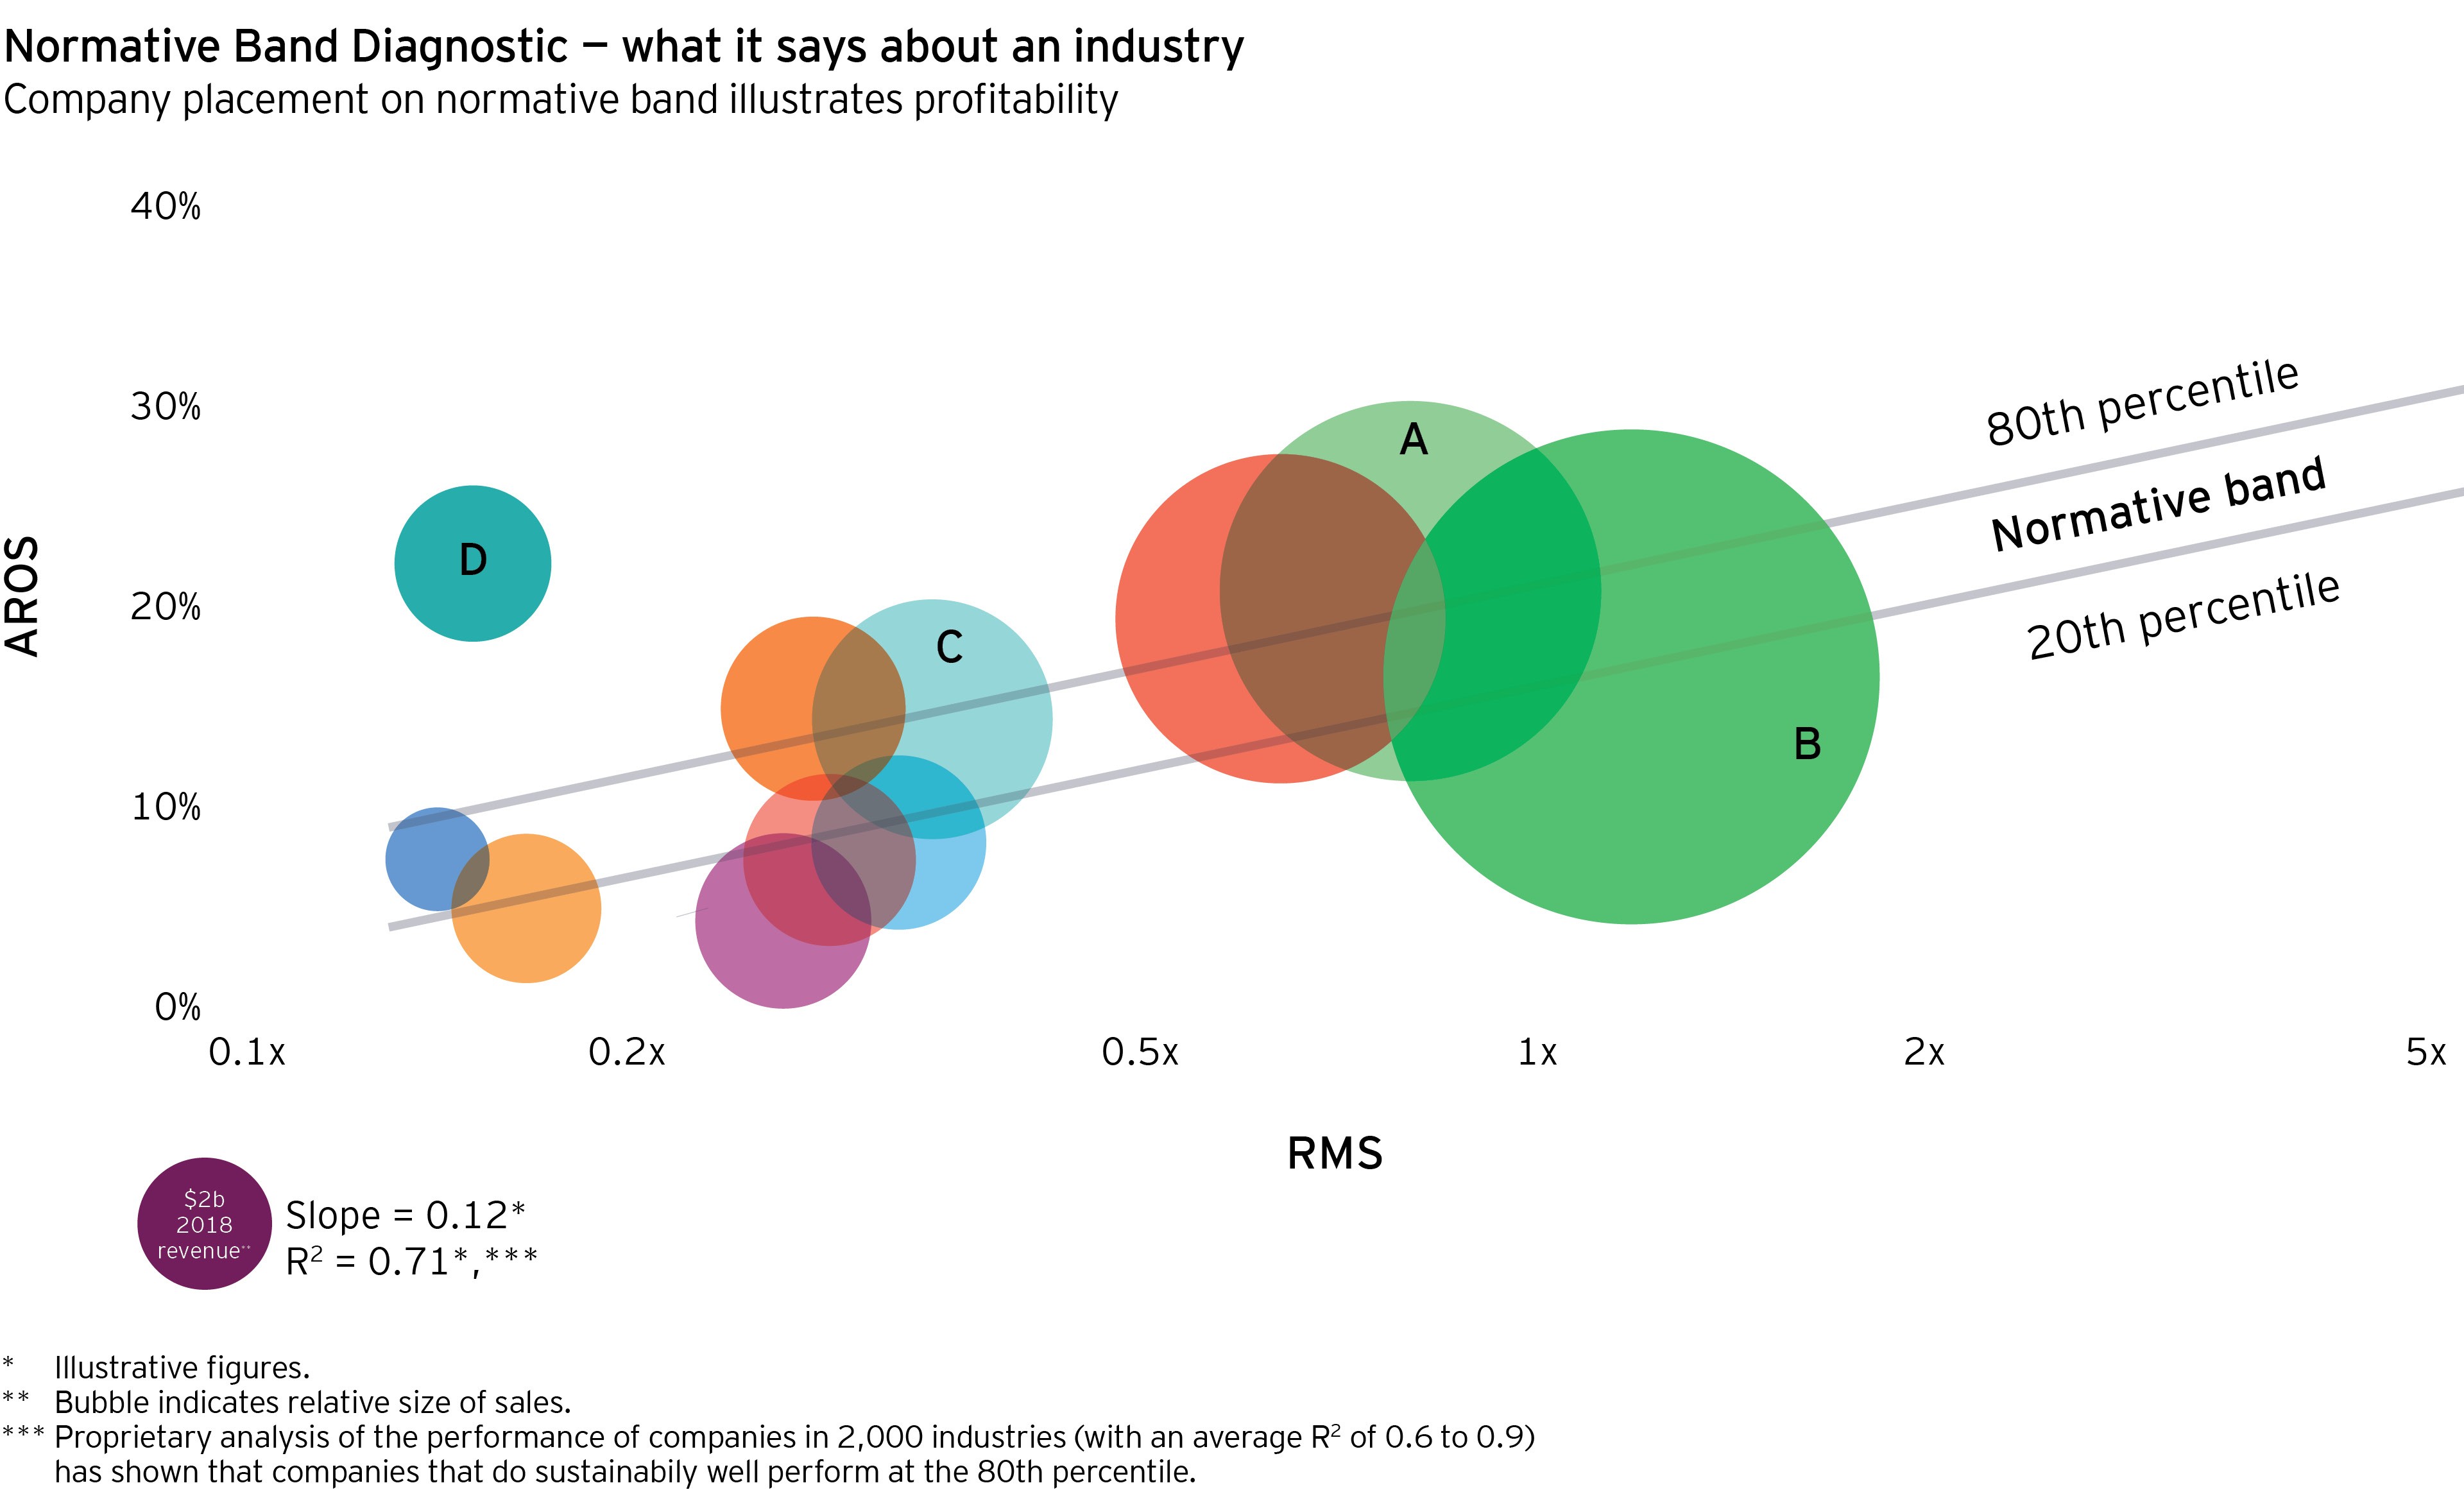
The above chart looks at a sample industry and the companies within it. Each company has a unique perspective and, therefore, a unique set of options it can pursue to achieve profitable growth.

  • Company A: If it is content with its current market position, leadership can adjust internally to target 80% performance at the current RMS to achieve optimal profitability (moving the center of the bubble up so that it aligns with the 80th percentile).
  •  Company B: It has the highest RMS, and perhaps achieved this by dropping prices. This can be risky as profitability will drop in the short term to gain this additional market share. The company must make sure it takes full advantage of its RMS to help regain profitability.
  • Company C: It could gain RMS by acquiring a near or direct competitor, such as Company D, in hopes of both increasing RMS and taking advantage of Company D’s high profitability.
  • Company D: If the above happens, diligence is important as Company D could be highly profitable at the fault of letting its R&D program wither, thus halting innovation. Or, it could have great leadership that manages profitability well. In turn, this could introduce a mindset and culture of efficiency that, if integrated properly, could boost the profitability of Company C. Each of these scenarios in Figure 3 addresses the need to gain more relative market share or improve AROS. In this example, Company C and Company D could use the analysis to identify specific M&A targets to accelerate the path to increased RMS and profitability.

It is essential for executives to determine where their own company fits on the normative band in relation to its competitors in order to make thoughtful strategic growth decisions.

Aligning M&A with strategy can help deliver long-term value

With disruption front and center across most industries, it is difficult to pinpoint growth goals with confidence. Organic growth, while an important factor, is often not enough to make a timely and significant business impact. M&A is required to help make up the difference. Understanding market context is critical in evaluating where market power lies in your industry, and how that impacts your business and acquisition opportunities to deliver long-term, profitable growth.

  • Show reference#Hide reference

    1. RMS indexes a business’s traditional market share by dividing by the share of the leading competitor. RMS for the leading competitor is calculated by dividing its share by that of the next-largest company. In each case, revenues of the end customer are used.

Summary

In today’s world of accelerating disruption, many companies are setting their strategy against a flawed view of the industry and markets in which they compete. In this article, we look at how to understand a company’s true competitive position, how technology is rapidly making current market assumptions outdated and how companies can use a market context to drive sustainable growth through M&A.

About this article

Authors
Jim Hsu

Global EY-Parthenon Strategy Leader

Strategy advisor providing insights and clarity into complex challenges. I believe in the power of market forces and data-driven analyses that challenge conventional thinking. Overly proud parent.

Andreas von Buchwaldt

EMEIA EY-Parthenon Strategy Leader

A strategy consultant. Experienced in private equity and technology, media and telecommunications.