Chapter 1
Analysis: The impact of market actions on global net-zero aims
Policy support for domestically produced renewables comes with challenges, as well as opportunities.
Domestically produced, low-cost, low-carbon and, in some cases, low-lead time energy – using local technology – looks more attractive than ever for governments around the world, with renewables being placed at the center of their energy policies.
The US Inflation Reduction Act (the Act), for example, prioritizes energy security and climate change through a combined investment of US$369b.1 A broad range of renewables assets is set to benefit from the Act’s incentives, credits and grants; this includes wind, solar, energy storage, carbon capture utilization and storage, the production of clean hydrogen, renewable natural gas, nuclear and electric vehicles. In the first eight months since its passage in August 2022, more than US$150b of capital investment poured into utility-scale US clean energy.2
Foreign companies are among those that have announced new US clean energy investments, and there is concern that the Act could cause an imbalance in international capital allocation. Other key markets, therefore, have had to respond rapidly to the potential impact of the legislation.
A prime example is the European Commission’s relaxation of state-aid rules3 to simplify subsidies for batteries, solar panels, wind turbines, heat pumps, electrolyzers, and carbon capture technology, as well as for the production of the components and raw materials used to manufacture them.4 The European Union’s REPowerEU initiative was already looking to bolster the bloc’s energy security by replacing natural gas imports from Russia with renewables, hydrogen, and biomethane.5 The UK is also planning energy reforms to delink gas and electricity prices.6
To spur investment in decarbonization, market competition is needed to speed up technological advances and bring cost down. Doing so will benefit the global energy transition.
India is expanding its renewables industry through a combination of ambitious government targets and private-sector actions; and China is stepping up activity in its dominant domestic market, while targeting exports where it already holds a competitive advantage, such as solar components. Other Asian markets, including Malaysia and Indonesia, are looking at how their solar markets can still flourish in the face of increased competition from larger economies.
Such competition can help speed up technological advances and bring down costs, which should benefit the energy transition and spur the investment needed to decarbonize and keep global temperature rises in check.
Markets leaning on renewables to help push their economies out of recession could also benefit from the need to strengthen domestic supply chains; creating jobs, expanding various industries, increasing gross domestic product, as well as enhancing people’s welfare.7
However, localized supply chains will have to be rapidly built or strengthened if net-zero targets are not to be delayed. Building these out will require new structures and partnerships to be created, and this will take time – especially as the International Monetary Fund expects economic growth to fall in 2023 and only rebound slightly in 2024.8
Despite such a slow-growth outlook, the investment landscape for low-carbon technologies has continued to evolve in recent years, as economies recover from the impacts of the COVID-19 pandemic while setting increasingly ambitious decarbonization targets. After an initial steady double-digit growth, energy transition deal volumes exploded over the last two years, with more growth expected as capital continues to flow into the space. In North America, deal volumes across all investor segments remained strong in 2022 following 2021's record year, though with a modest reduction in overall volumes.9
Conditions, therefore, appear ripe for turbocharging renewable energy demand and accelerating the journey to net zero – but it remains to be seen whether market interventions such as the US Inflation Reduction Act will speed up or delay the energy transition.
Chapter 2
Key developments: renewables highlights from around the world
Key developments: From Egypt’s wind ambitions to Japan’s push to increase solar PV market share.
Developing policies to encourage the buildout of renewables has risen to the top of many governments’ agendas, and this push for energy security in a recessionary environment has created a viable opportunity for significant investment.
Download the RECAI top 40 ranking (pdf) for details on technology-specific scores, and see methodology for details on how ranking and scores are determined.
Chapter 3
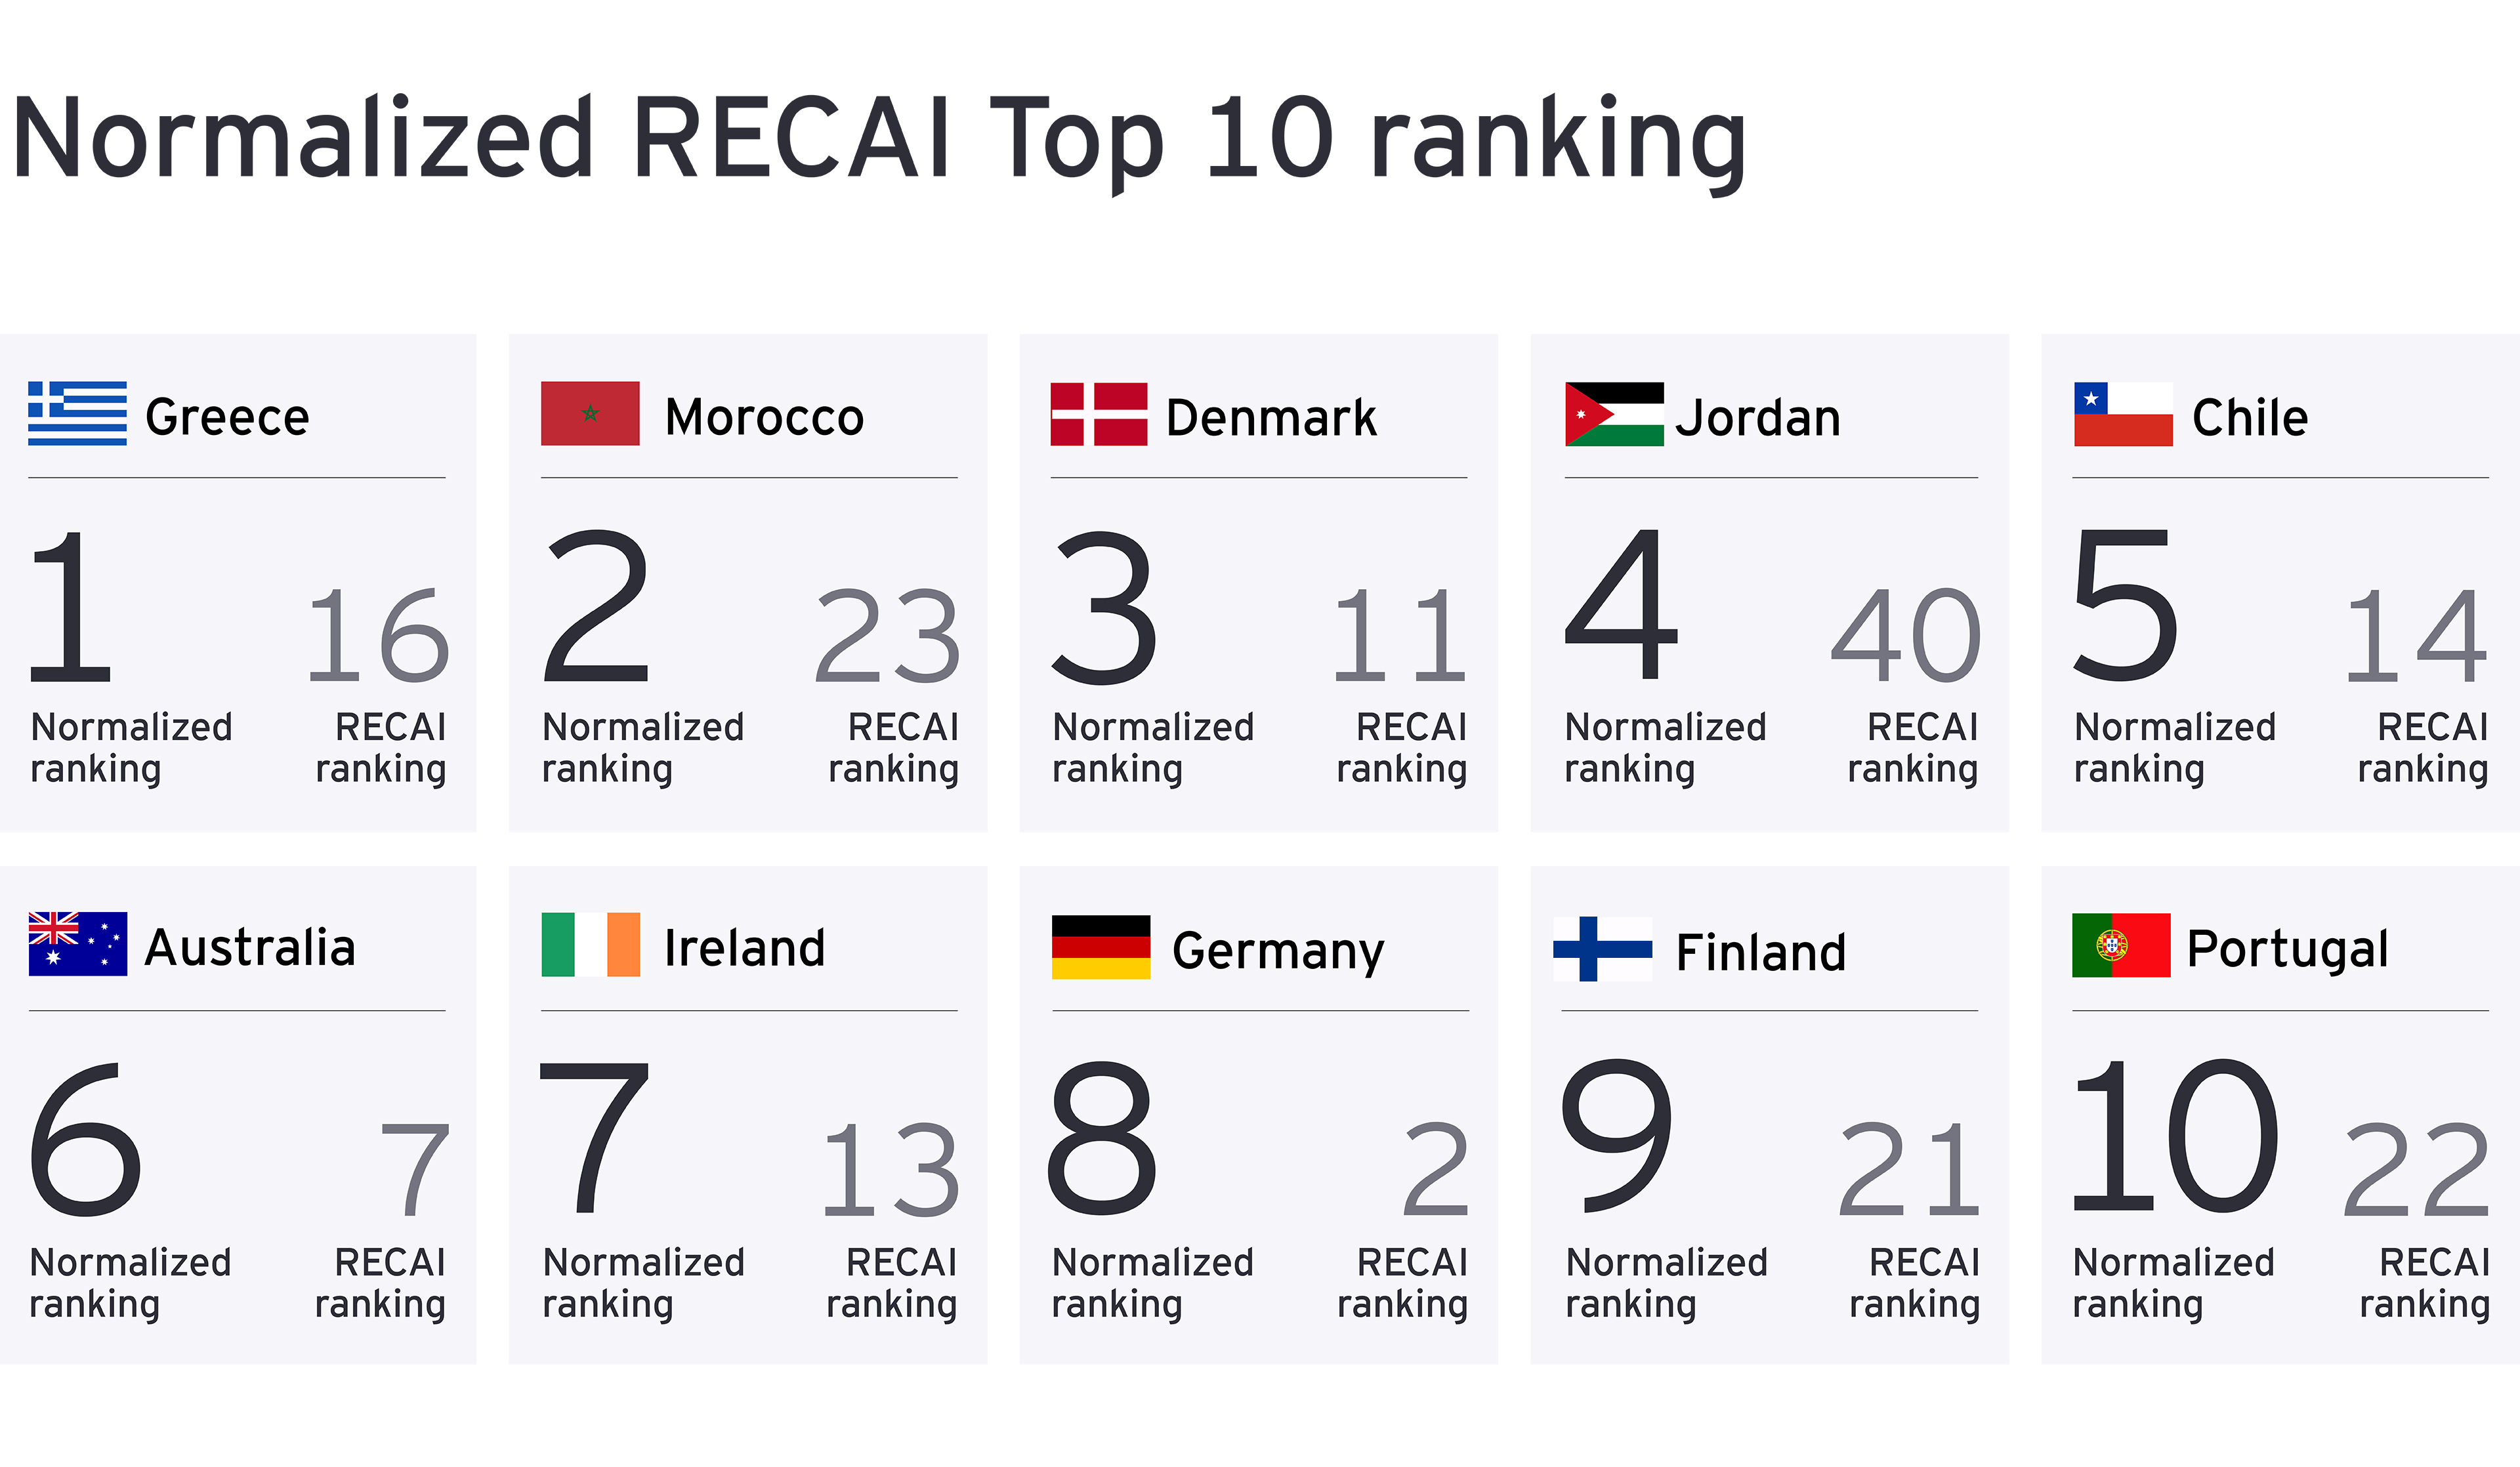
Normalized index
Showcasing markets performing above expectations for their economic size.
The RECAI uses various criteria to compare the attractiveness of renewables markets, such as the magnitude of development pipeline, that reflect the absolute size of the renewable investment opportunity. Hence, the index naturally benefits large economies. By normalizing with the gross domestic product, we can see which markets are performing above expectations for their economic size. In this way, the normalized index helps reveal ambitious plans in smaller economies, creating some attractive alternatives for potential investors.

Chapter 4
Corporate PPAs ride out bumpy year to come out on top in Europe
As global markets calm, prices have eased and the PPA market is becoming more balanced again.
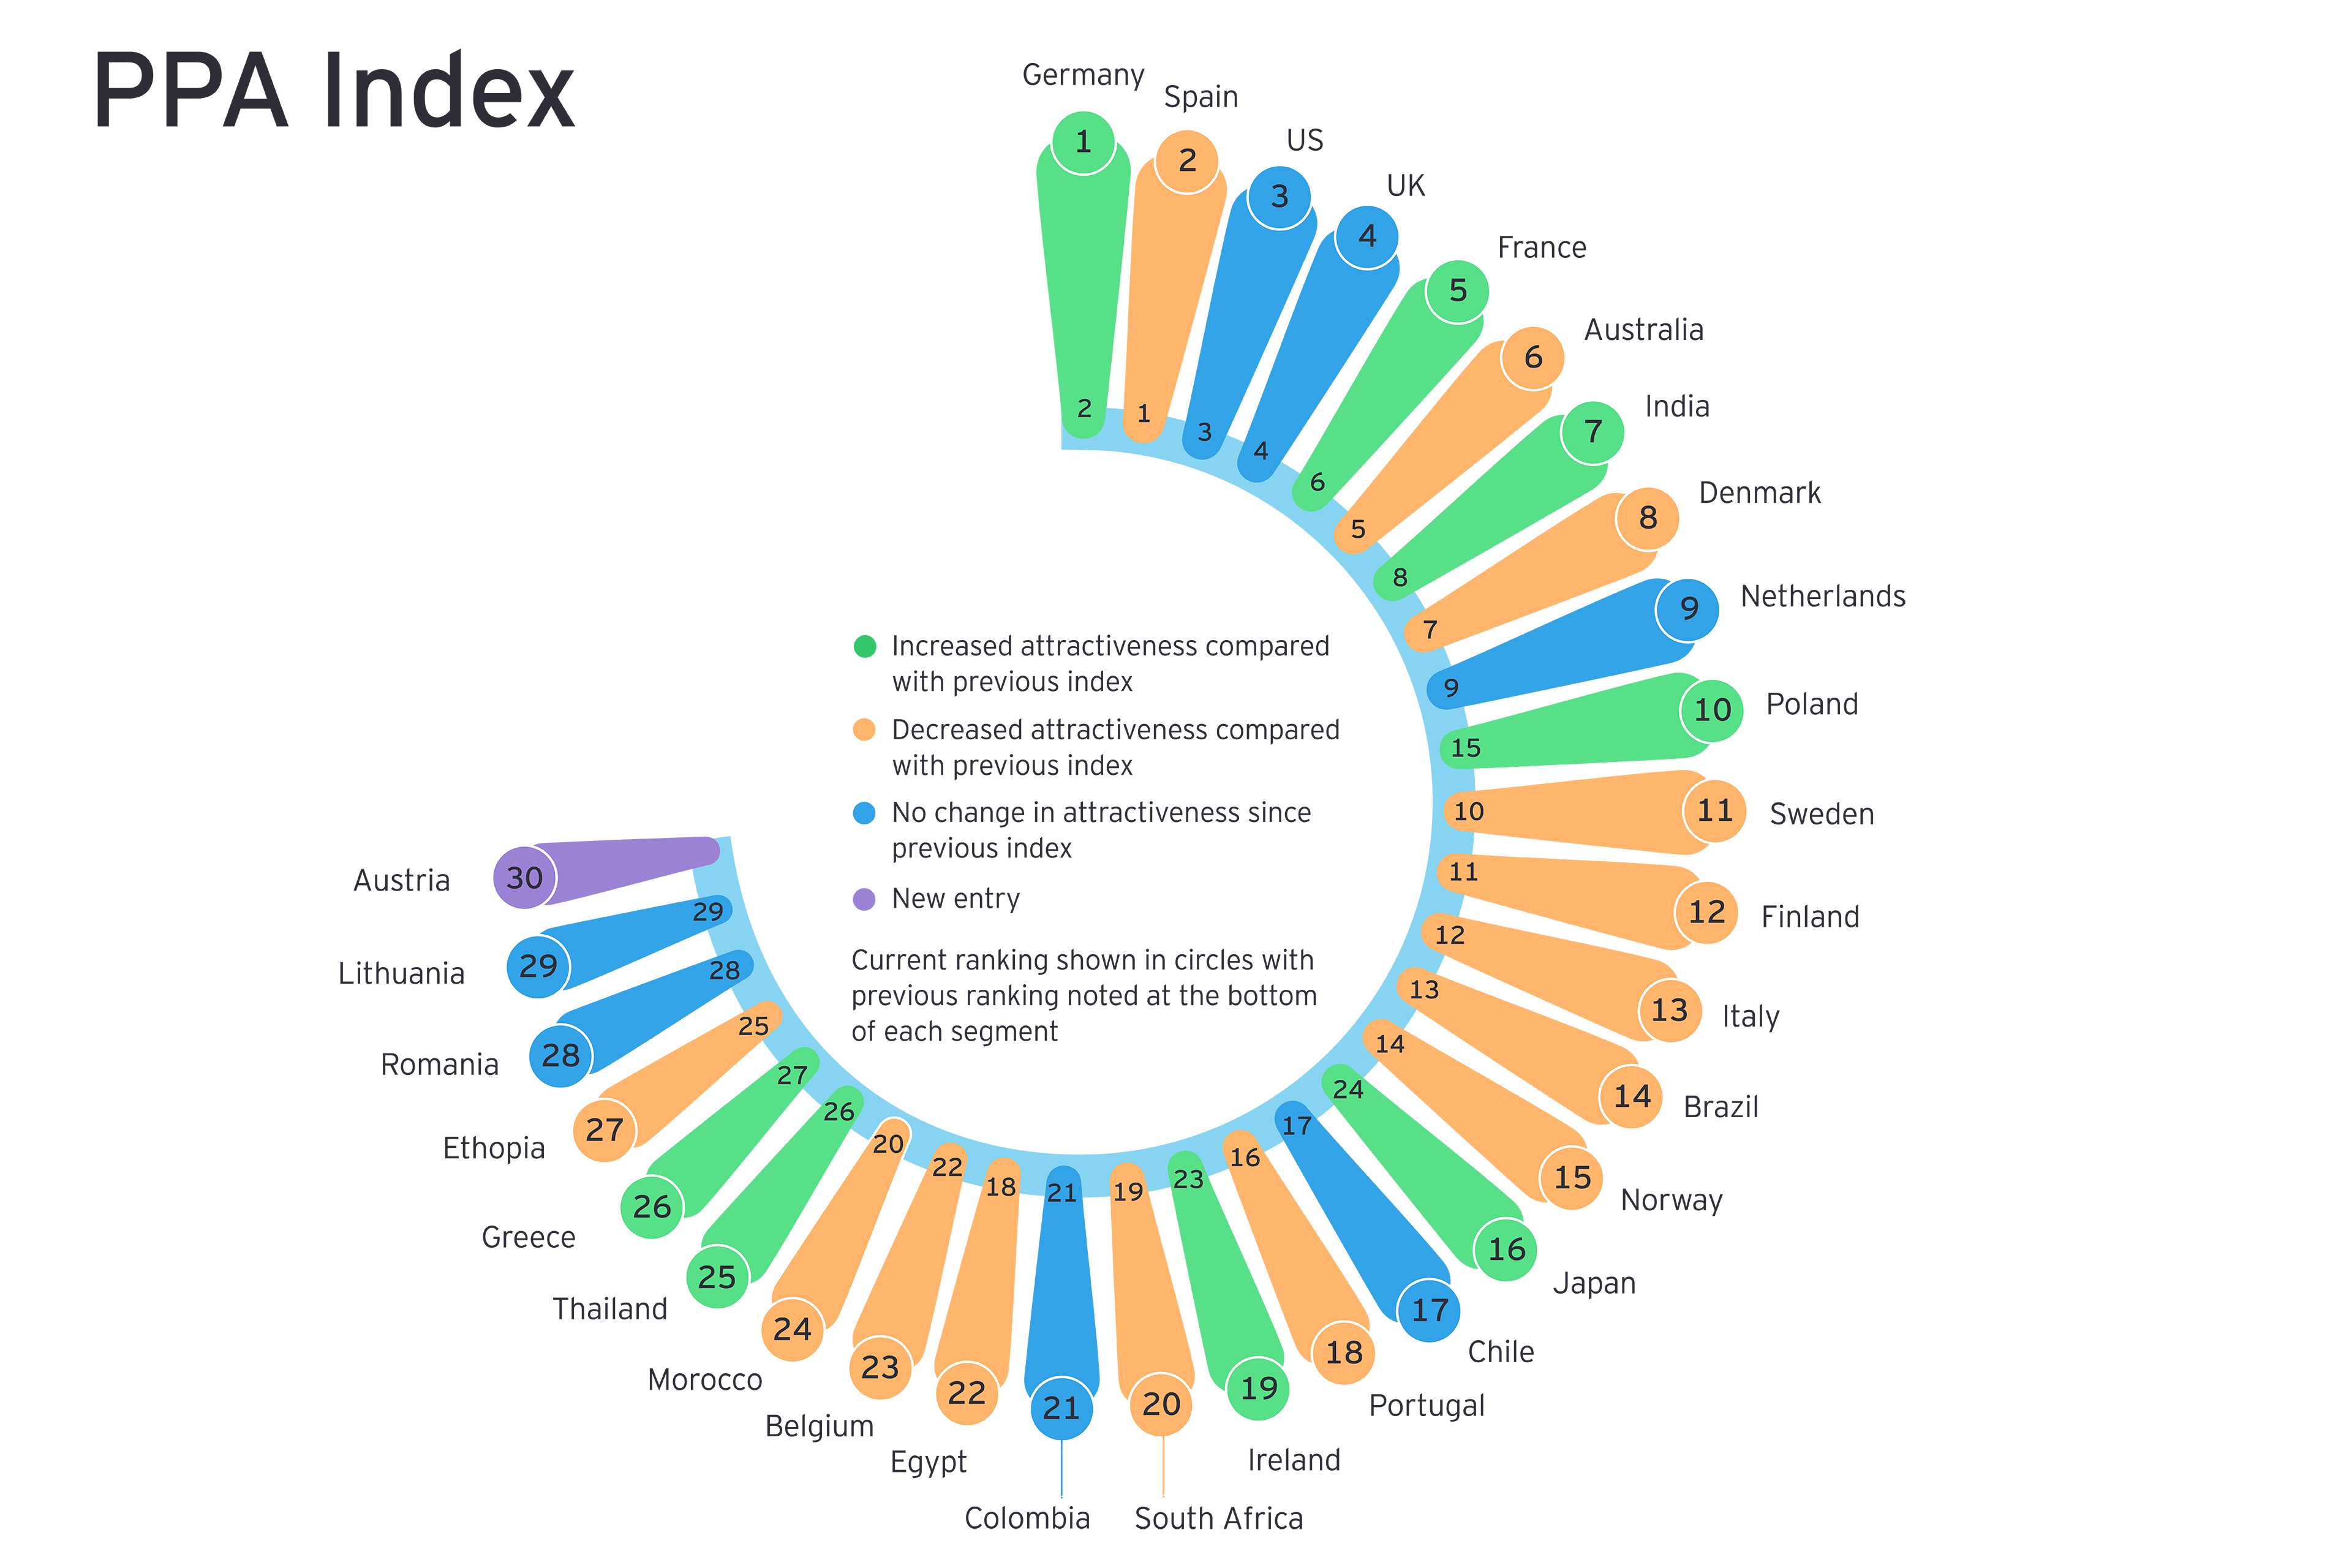
During 2022, corporate power purchase agreements (PPAs) significantly overtook utility PPAs in Europe, both in terms of capacity (7GW of 8.4GW) and deal count (129 of 161 deals).10 This trend is expected to develop in other parts of the world.
It has not been an easy ride for corporates in the past year however, with volatile, sky-high pricing – plus project scarcity – flipping the market in the sellers’ favor. Inflation also affected PPA pricing structures, with few developers agreeing to no indexation – but this requirement has eased, with most now offering flat nominal pricing.
During early 2023 as global markets calmed, prices have eased considerably, and the PPA market is becoming more balanced again. With wholesale power price futures generally reducing compared with current prices in many markets, some countries being at risk of increased cannibalization of renewables’ capture prices, and developers needing long-term revenue security, the power of a long-term PPA is sending sellers back to corporates.
Physical and sleeved PPAs are becoming less popular, as “shaping” costs have spiraled, while pay-as-produced virtual PPAs are now the norm in many deregulated markets.

The EY corporate PPA Index uses key parameters from four pillars to analyze and rank the growth potential of a nation’s corporate PPA market. For details on data and methodology, download the EY Corporate PPA Index (pdf).
Chapter 5
Regional focus: India
Round-the-clock electricity supply is a must if the market is to be a key producer of green hydrogen.
India is experiencing rapid growth in its renewables industry. According to the International Energy Agency, it has the fastest rate of renewable electricity growth of any major economy, with new capacity additions on track to double between the start of 2022 and 2026,11 having already doubled between 2015 and 2022 to reach 163GW.12
As of February 2023, renewables accounted for about 42.5% of India’s installed power-generation capacity.13 Solar has been the market’s most important renewables asset, accounting for 63GW of its total renewables’ capacity, followed by hydropower at 47GW and wind power at 42GW.14
The government’s latest draft National Electricity Plan sets out how it intends to expand the transmission infrastructure network by 300GW by 2030, and reach 500GW of renewables capacity by 2030,15 while achieving net-zero greenhouse gas emissions by 2070.
Meanwhile, India’s private sector – and, in particular, commercial and industrial (C&I) companies – is increasingly looking to renewable PPAs because of the high grid tariffs associated with coal-derived energy.16 With the capital market evolving around C&I PPAs, costs for power have come down compared with purchasing from the grid. Indeed, India is now one of the fastest-growing PPA markets in the world.
India's export advantage could be boosted by new and upcoming technologies, such as green hydrogen, which are making their way into the domestic renewable energy mix. This reinforces the importance of RTC supply of usable clean energy.
The growing share of renewable power generation means that supply intermittency is becoming a bigger concern. As a result, ensuring round-the-clock (RTC) supply is becoming more of a priority. India’s pure pumped storage capacity, likely to increase in the coming years, is expected to assist with this.
In addition, new and upcoming technologies, such as green hydrogen, are making their way into the domestic renewable energy mix to such an extent that they could boost India’s export advantage. This reinforces the importance of RTC supply of usable clean energy for potential offtakers.
Under its recently launched National Green Hydrogen Mission – which has an initial outlay of INR197b (US$2.4b) – India is also targeting production of 5 million metric tonnes of green hydrogen by 2030,17 which could help it become a green hydrogen export hub, shipping to Europe. And India’s Greenko Group has already signed a memorandum of understanding for negotiating a first-of-its-kind deal to supply green ammonia to Germany’s Uniper.18
While India has set ambitious targets for its renewables industry, it will need to provide more subsidies for industry players to achieve its goal of 500GW of renewable capacity by 2030. It is estimated that a doubling of investment – to INR2.44t (US$28b) per year – will be needed between 2022 and 2029.19 Nevertheless, as the market increases its support for renewables, storage and green hydrogen, it is making significant progress on decarbonization and is a fast-growing market on which to keep a close eye.
Related articles
Summary
To address concerns about energy supply and affordability, governments are legislating to accelerate domestic renewables production, using local technology. The US Inflation Reduction Act, for example, has sparked competition in the industry, which could help accelerate decarbonization. However, it could also cause an imbalance in international capital allocation, and net-zero targets could be missed if localized supply chains are not put in place quickly enough.

