Non-financial ODI achieved rapid growth, with B&R partner countries surpassing the overall growth rate1
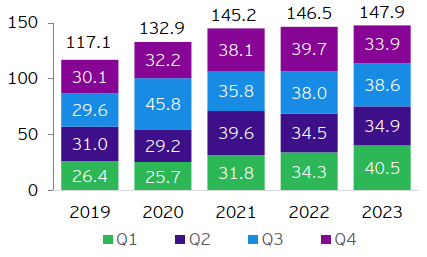
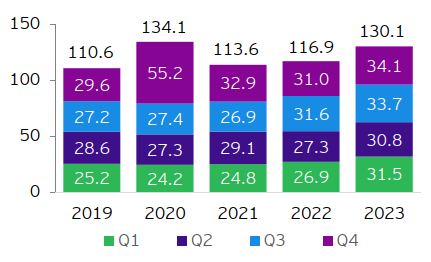
In 2023, China's overall ODI reached US$147.9 billion, up 0.9% YOY (in terms of RMB1,041.9 billion, up 5.7% YOY). Non-financial ODI amounted to US$130.1 billion, up 11.4% YOY (RMB917 billion, up 16.7% YOY). Specifically, non-financial ODI in B&R partner countries reached US$31.8 billion, up 22.6% (RMB224.1 billion, up 28.4% YOY), accounting for nearly a quarter of the total. According to State Administration of Foreign Exchange of China, RMB has depreciated by 4.55% in 2023 compared to the previous year4, leading to a relatively lower growth rate of ODI denominated in US dollars.
Figure 1: China overall ODI (US$ billion)
Note: The round-up statistics in this article may not add to the actual totals.
Source: Monthly Statistics in Brief, China MOFCOM
Figure 2: China’s non-financial ODI (US$ billion)
Note: The round-up statistics in this article may not add to the actual totals.
Source: Monthly Statistics in Brief, China MOFCOM
China overseas M&A values achieved consecutive QOQ growth for three quarters, significant increase in number of large transactions compared to the previous year2
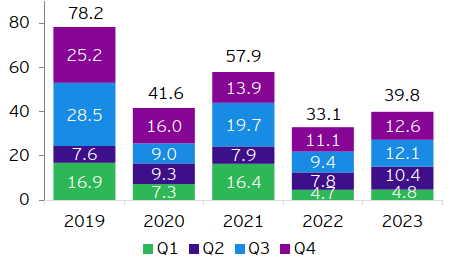
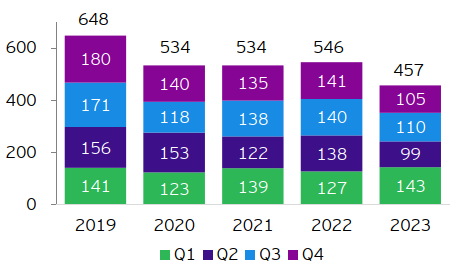
In 2023, China announced a total overseas M&A value of US$39.8 billion, up 20.3% YOY and achieving consecutive QOQ growth for three quarters. Despite a decrease in deal volume to 457, down by 16.3% YOY, the year witnessed a substantial increase in large transactions. Specifically, there were 21 deals exceeding US$500 million, an increase of 13 deals compared to 2022. China’s M&A value in B&R partner countries reached US$17.3 billion, showing a YOY growth of 32.4%, surpassing the overall growth rate. Although deal volume decreased 2.6% YOY to 185, it was significantly smaller than the overall decline. Moreover, the proportion of M&A value in B&R partner countries increased by four percentage points compared to the same period last year, reaching 44%.
Figure 3: Value of China announced overseas M&As (US$ billion)
Note: The round-up statistics in this article may not add to the actual totals.
Sources: Refinitiv, Mergermarket, including data from Hong Kong, Macau, and Taiwan, and deals that have been announced but not yet completed, data was downloaded on 8 January 2024; EY analysis
Figure 4: Volume of China announced overseas M&As (Number of deals)
Note: The round-up statistics in this article may not add to the actual totals.
Sources: Refinitiv, Mergermarket, including data from Hong Kong, Macau, and Taiwan, and deals that have been announced but not yet completed, data was downloaded on 8 January 2024; EY analysis
Figure 5: Announced China overseas M&As by sector (By deal value)
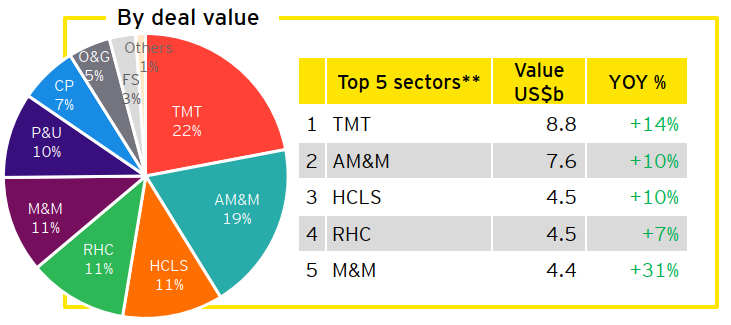
**AM&M refers to advanced manufacturing & mobility; HCLS refers to health care & life sciences; RHC refers to real estate, hospitality & construction; M&M refers to mining & metals; P&U refers to power & utilities; CP refers to consumer products; FS refers to financial services.
Sources: Refinitiv, Mergermarket, including data from Hong Kong, Macau, and Taiwan, and deals that have been announced but not yet completed, data was downloaded on 8 January 2024; EY analysis
Figure 6: Announced China overseas M&As by sector (By deal volume)
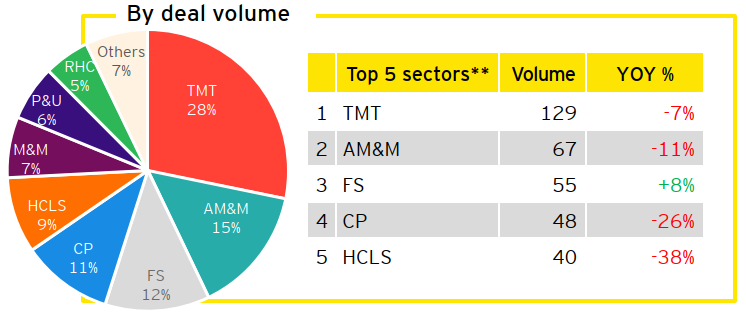
**AM&M refers to advanced manufacturing & mobility; HCLS refers to health care & life sciences; RHC refers to real estate, hospitality & construction; M&M refers to mining & metals; P&U refers to power & utilities; CP refers to consumer products; FS refers to financial services.
Sources: Refinitiv, Mergermarket, including data from Hong Kong, Macau, and Taiwan, and deals that have been announced but not yet completed, data was downloaded on 8 January 2024; EY analysis
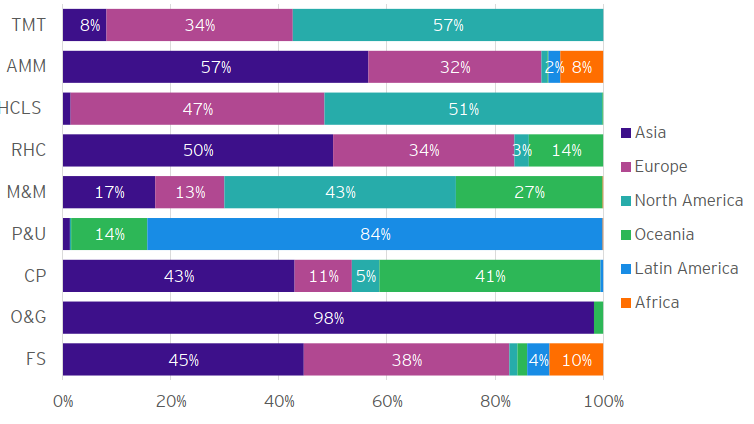
Figure 7: Regional distribution of announced China overseas M&As by sector (By deal value)
Sources: Refinitiv, Mergermarket, including data from Hong Kong, Macau, and Taiwan, and deals that have been announced but not yet completed, data was downloaded on 8 January 2024; EY analysis
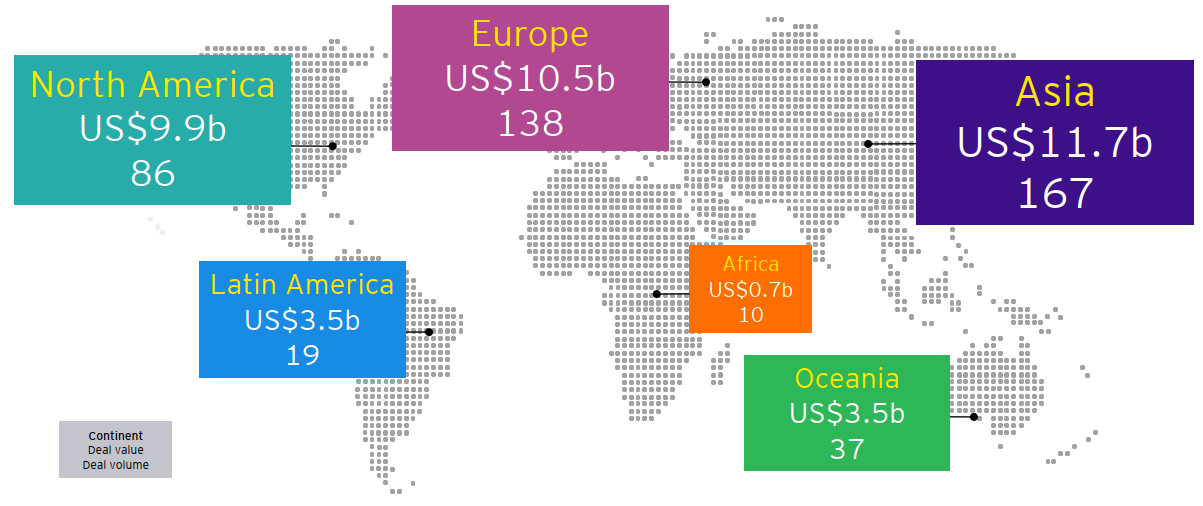
Figure 8: Deal value and volume of China overseas M&As by continent
Sources: Refinitiv, Mergermarket, including data from Hong Kong, Macau, and Taiwan, and deals that have been announced but not yet completed, data was downloaded on 8 January 2024; EY analysis
Figure 9: Top 10 destinations of China overseas M&As (By deal value, US$ billion)
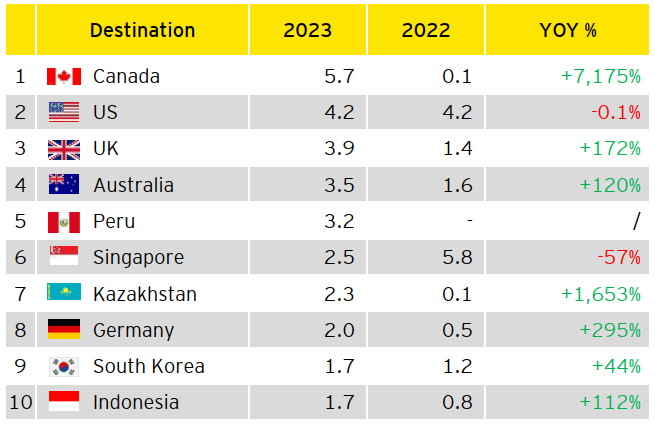
Sources: Refinitiv, Mergermarket, including data from Hong Kong, Macau, and Taiwan, and deals that have been announced but not yet completed, data was downloaded on 8 January 2024; EY analysis
Figure 10: Top 10 destinations of China overseas M&As (By deal volume, number of deals)
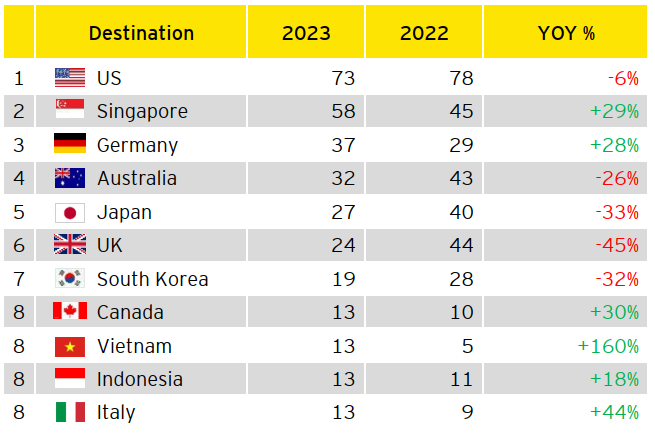
Sources: Refinitiv, Mergermarket, including data from Hong Kong, Macau, and Taiwan, and deals that have been announced but not yet completed, data was downloaded on 8 January 2024; EY analysis
The value of newly-signed EPC projects slightly decreased YOY, with over 80% attributed to B&R partner countries1
In 2023, the value of newly-signed China overseas EPC projects reached US$264.5 billion, up 4.5% YOY. New contracts in B&R partner countries totaled US$227.2 billion, up 5.7% YOY, comprising 86% of the total.
The completed turnover of overseas EPC projects by Chinese enterprises was US$160.9 billion, up 3.8% YOY. The completed turnover in B&R partner countries reached US$132.1 billion, up 4.8% YOY, comprising 82% of the total.
Figure 11: Value of newly-signed China overseas EPC contracts (US$ billion)
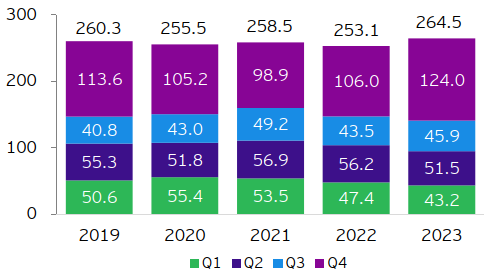
Note: The round-up statistics in this article may not add to the actual totals.
Source: Monthly Statistics in Brief, China MOFCOM
Figure 12: Value of completed turnover of China overseas EPC contracts (US$ billion)
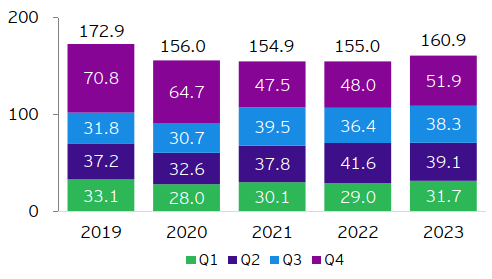
Note: The round-up statistics in this article may not add to the actual totals.
Source: Monthly Statistics in Brief, China MOFCOM
Summary
EY Greater China region released the Overview of China outbound investment of 2023. The report highlights a 0.9% YOY growth in China’s overall ODI, reaching US$147.9 billion; non-financial ODI increased by 11.4%, showing rapid growth, with B&R partner countries outpacing the overall increase. Additionally, Chinese enterprises announced a total overseas M&A value of US$39.8 billion, growing by 20.3% YOY. Notably, this marks three consecutive quarters of QOQ growth and accompanied by a significant increase in number of large transactions compared to the preceding year.


